



Which Nations Championship Teams Face the Toughest Tournament?
Written by Alex Bird
- England faced an exceptionally difficult three-Test July programme, travelling from Johannesburg to Liverpool and then Santiago del Estero on three successive weekends. The sequence involved two intercontinental transfers and racked up an estimated 6,815 avoidable miles.[1]
- The four Rugby Championship (Southern Hemisphere) teams appear to have the easiest overall schedules.
- Our index places Fiji as facing the toughest tournament overall, partly a consequence of the geographical disadvantage of playing all of their “home” fixtures thousands of miles from Fiji.
The inaugural Nations Championship is now underway, with the opening July window behind us.[1]
Designed to shake up international rugby union, the biennial competition blends the sport’s traditional July and November touring windows with something not far away from international football’s UEFA Nations League.
It turns previously standalone Tests into part of a wider competition, incorporating points, standings and a Finals Weekend, all with the intention of injecting greater meaning and jeopardy into every match.
Combining the two concepts has thrown up a lot of quirks, including unorthodox scheduling, teams playing “home” matches thousands of miles from their own nations and fixture lists that vary quite dramatically in difficulty.
A recent study involving professional rugby players found that demanding travel itineraries could have consequences for player performance on a physical and cognitive.[7]
In July 2026, England forward Ben Earl questioned the logic of England travelling from Johannesburg to Liverpool and then on to Santiago del Estero across three successive weekends.[2]
Those matches took place on 4, 11 and 18 July, leaving only a week between each leg.[1]
With this new format now in practice and appearing to show some interesting wrinkles, it is a good opportunity to explore which country faces the most difficult tournament once opponent quality, travel, recovery and fixture sequencing are considered together.
So What Is the Nations Championship?
For the uninitiated, the Nations Championship is a cross-hemisphere competition involving 12 leading national teams, each playing six fixtures across two windows in July and November.[1]
The November rounds are followed immediately by a rank-matched Finals Weekend at Allianz Stadium, Twickenham, from 27 to 29 November.
The teams are paired according to where they finish in their respective hemisphere table, from sixth against sixth up to the Grand Final between the two table-toppers.[1]
For those familiar with football, the similarities with the UEFA Nations League are hard to avoid. However, the football competition takes place largely within UEFA’s far smaller geographical footprint, while the rugby version is complicated by long-haul travel and the adoption of touring patterns that have been in place for decades.
The result is a mix of traditional tours and a decentralised global tournament, with all 12 teams playing once in six matches arranged across three double-headers on one climactic weekend.
By comparison, football’s UEFA Nations League final tournament is reserved for just four teams.[3]
Why some Nations Championship Schedules are Tougher than Others
What makes one team’s path different is not simply the opposition, as every Northern Hemisphere side faces all six Southern Hemisphere teams and vice versa before Finals Weekend.[1]
Instead, the choice of venues and the ordering of fixtures can create very different levels of difficulty.
Facing the Springboks in Johannesburg is naturally a different proposition from hosting them in Europe, while a conventional overseas tour is very different from a schedule that requires teams to cross continents in consecutive weeks.
The venue arrangements are unusual enough that World Rugby cited Fiji’s three “home” matches in Britain and Japan’s match against Ireland in Australia when it removed home weighting from its rankings system in July 2026.[4]
Travel is naturally unavoidable, but the quirks of the Nations Championship schedule can add hundreds or even thousands of avoidable air miles to a team’s route, making its progress more difficult on paper.
How our Nations Championship Difficulty Index Works
To isolate the unique and novel challenges posed by the Nations Championship schedule, we developed an index that combines the sporting difficulty of each team’s fixtures with the logistical demands of travel and recovery.
Our venue-adjusted opponent score accounts for 45% of the final result.
The remaining 55% measures fixture sequencing, travel between matches, recovery time and the likely difficulty of Finals Weekend.
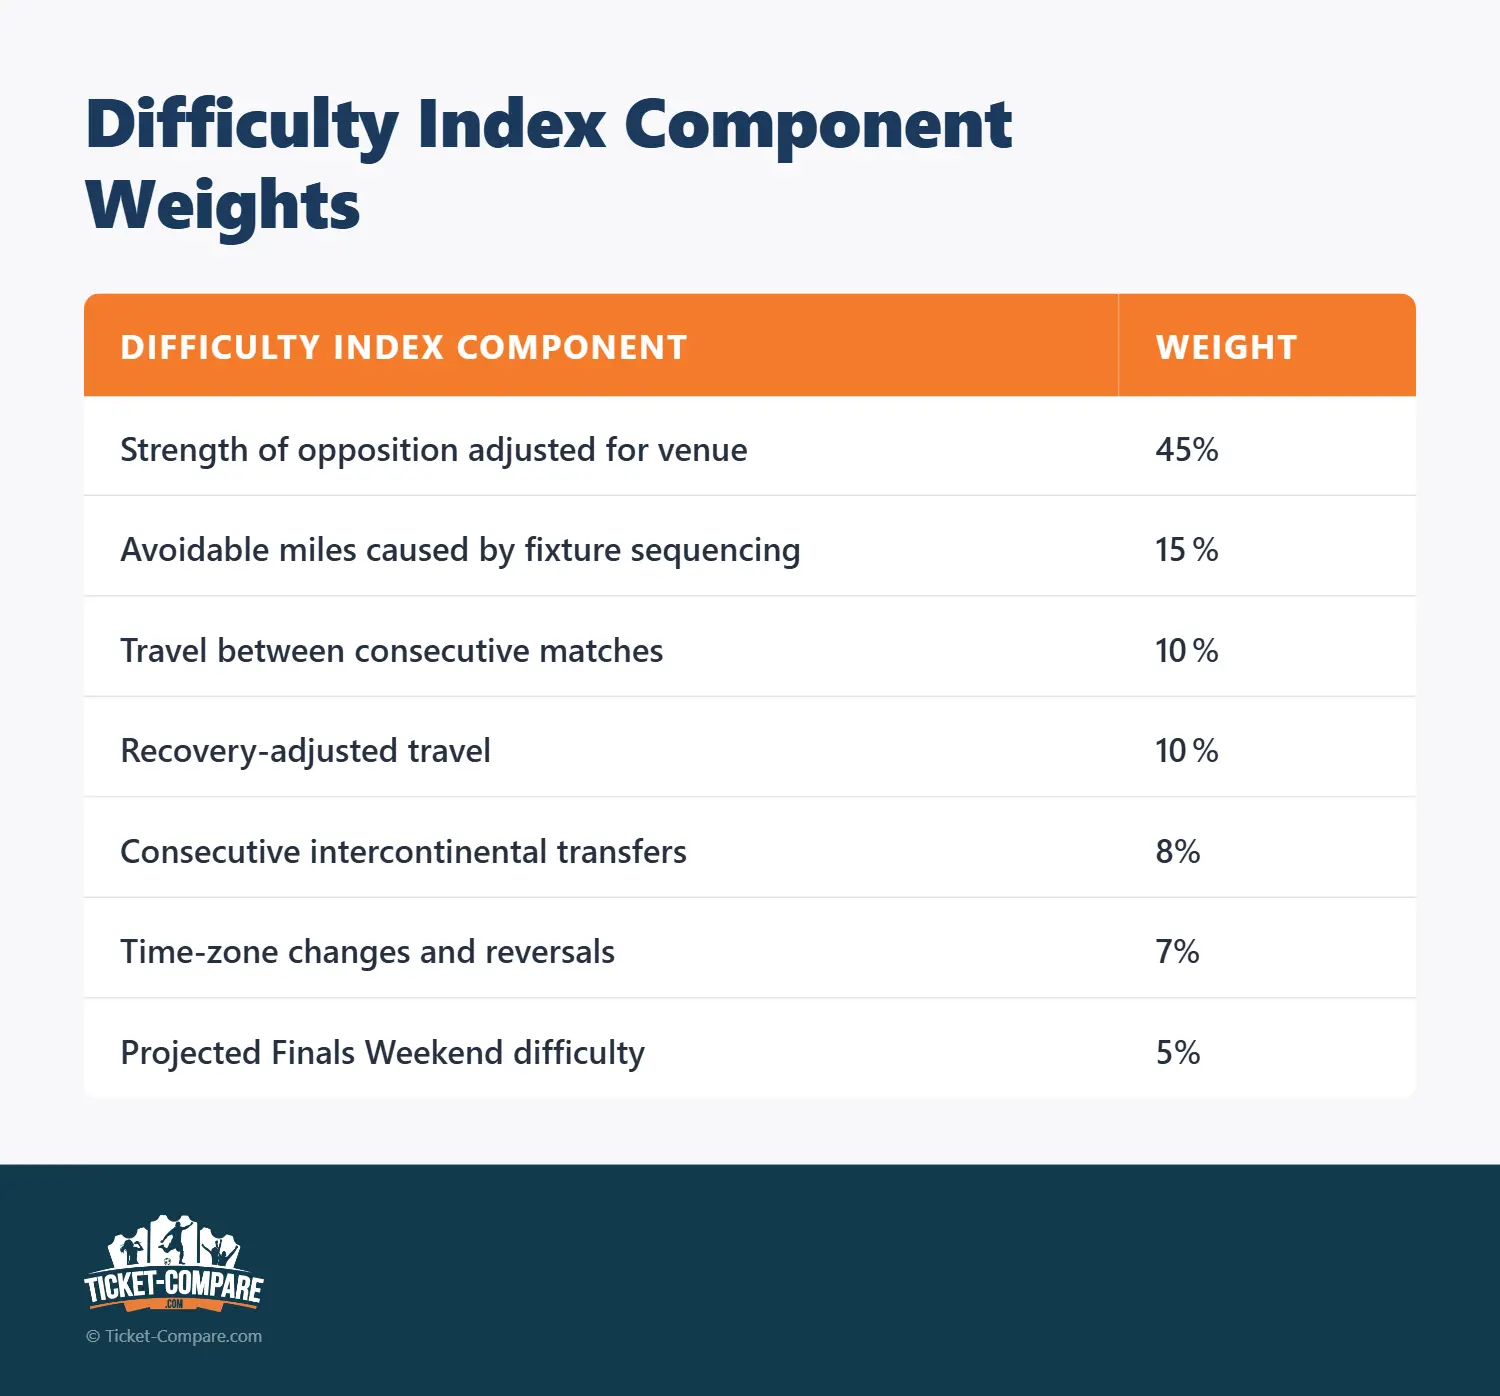
The index has seven components:
- Strength of opposition adjusted for venue
- Avoidable miles caused by fixture sequencing
- Travel between consecutive matches
- Recovery-adjusted travel
- Consecutive intercontinental transfers
- Time-zone changes and reversals
- Projected Finals Weekend difficulty
Strength of opposition is based on the World Rugby ratings published immediately before the July window, with our own adjustment applied for home, away and neutral fixtures.
Mileage calculations use great-circle distances between host cities and designated home hubs.
It assumes that teams return home between the July and November windows (which is less obvious than it may sound), while the shortest possible route reorders the same venues within each window.
The Finals Weekend element remains provisional because the pairings will depend on the final hemisphere standings. So let’s look at the table.
Nations Championship Schedules Ranked from Toughest to Easiest
The highest overall score is normalised to 100, with the other teams scored relative to it.
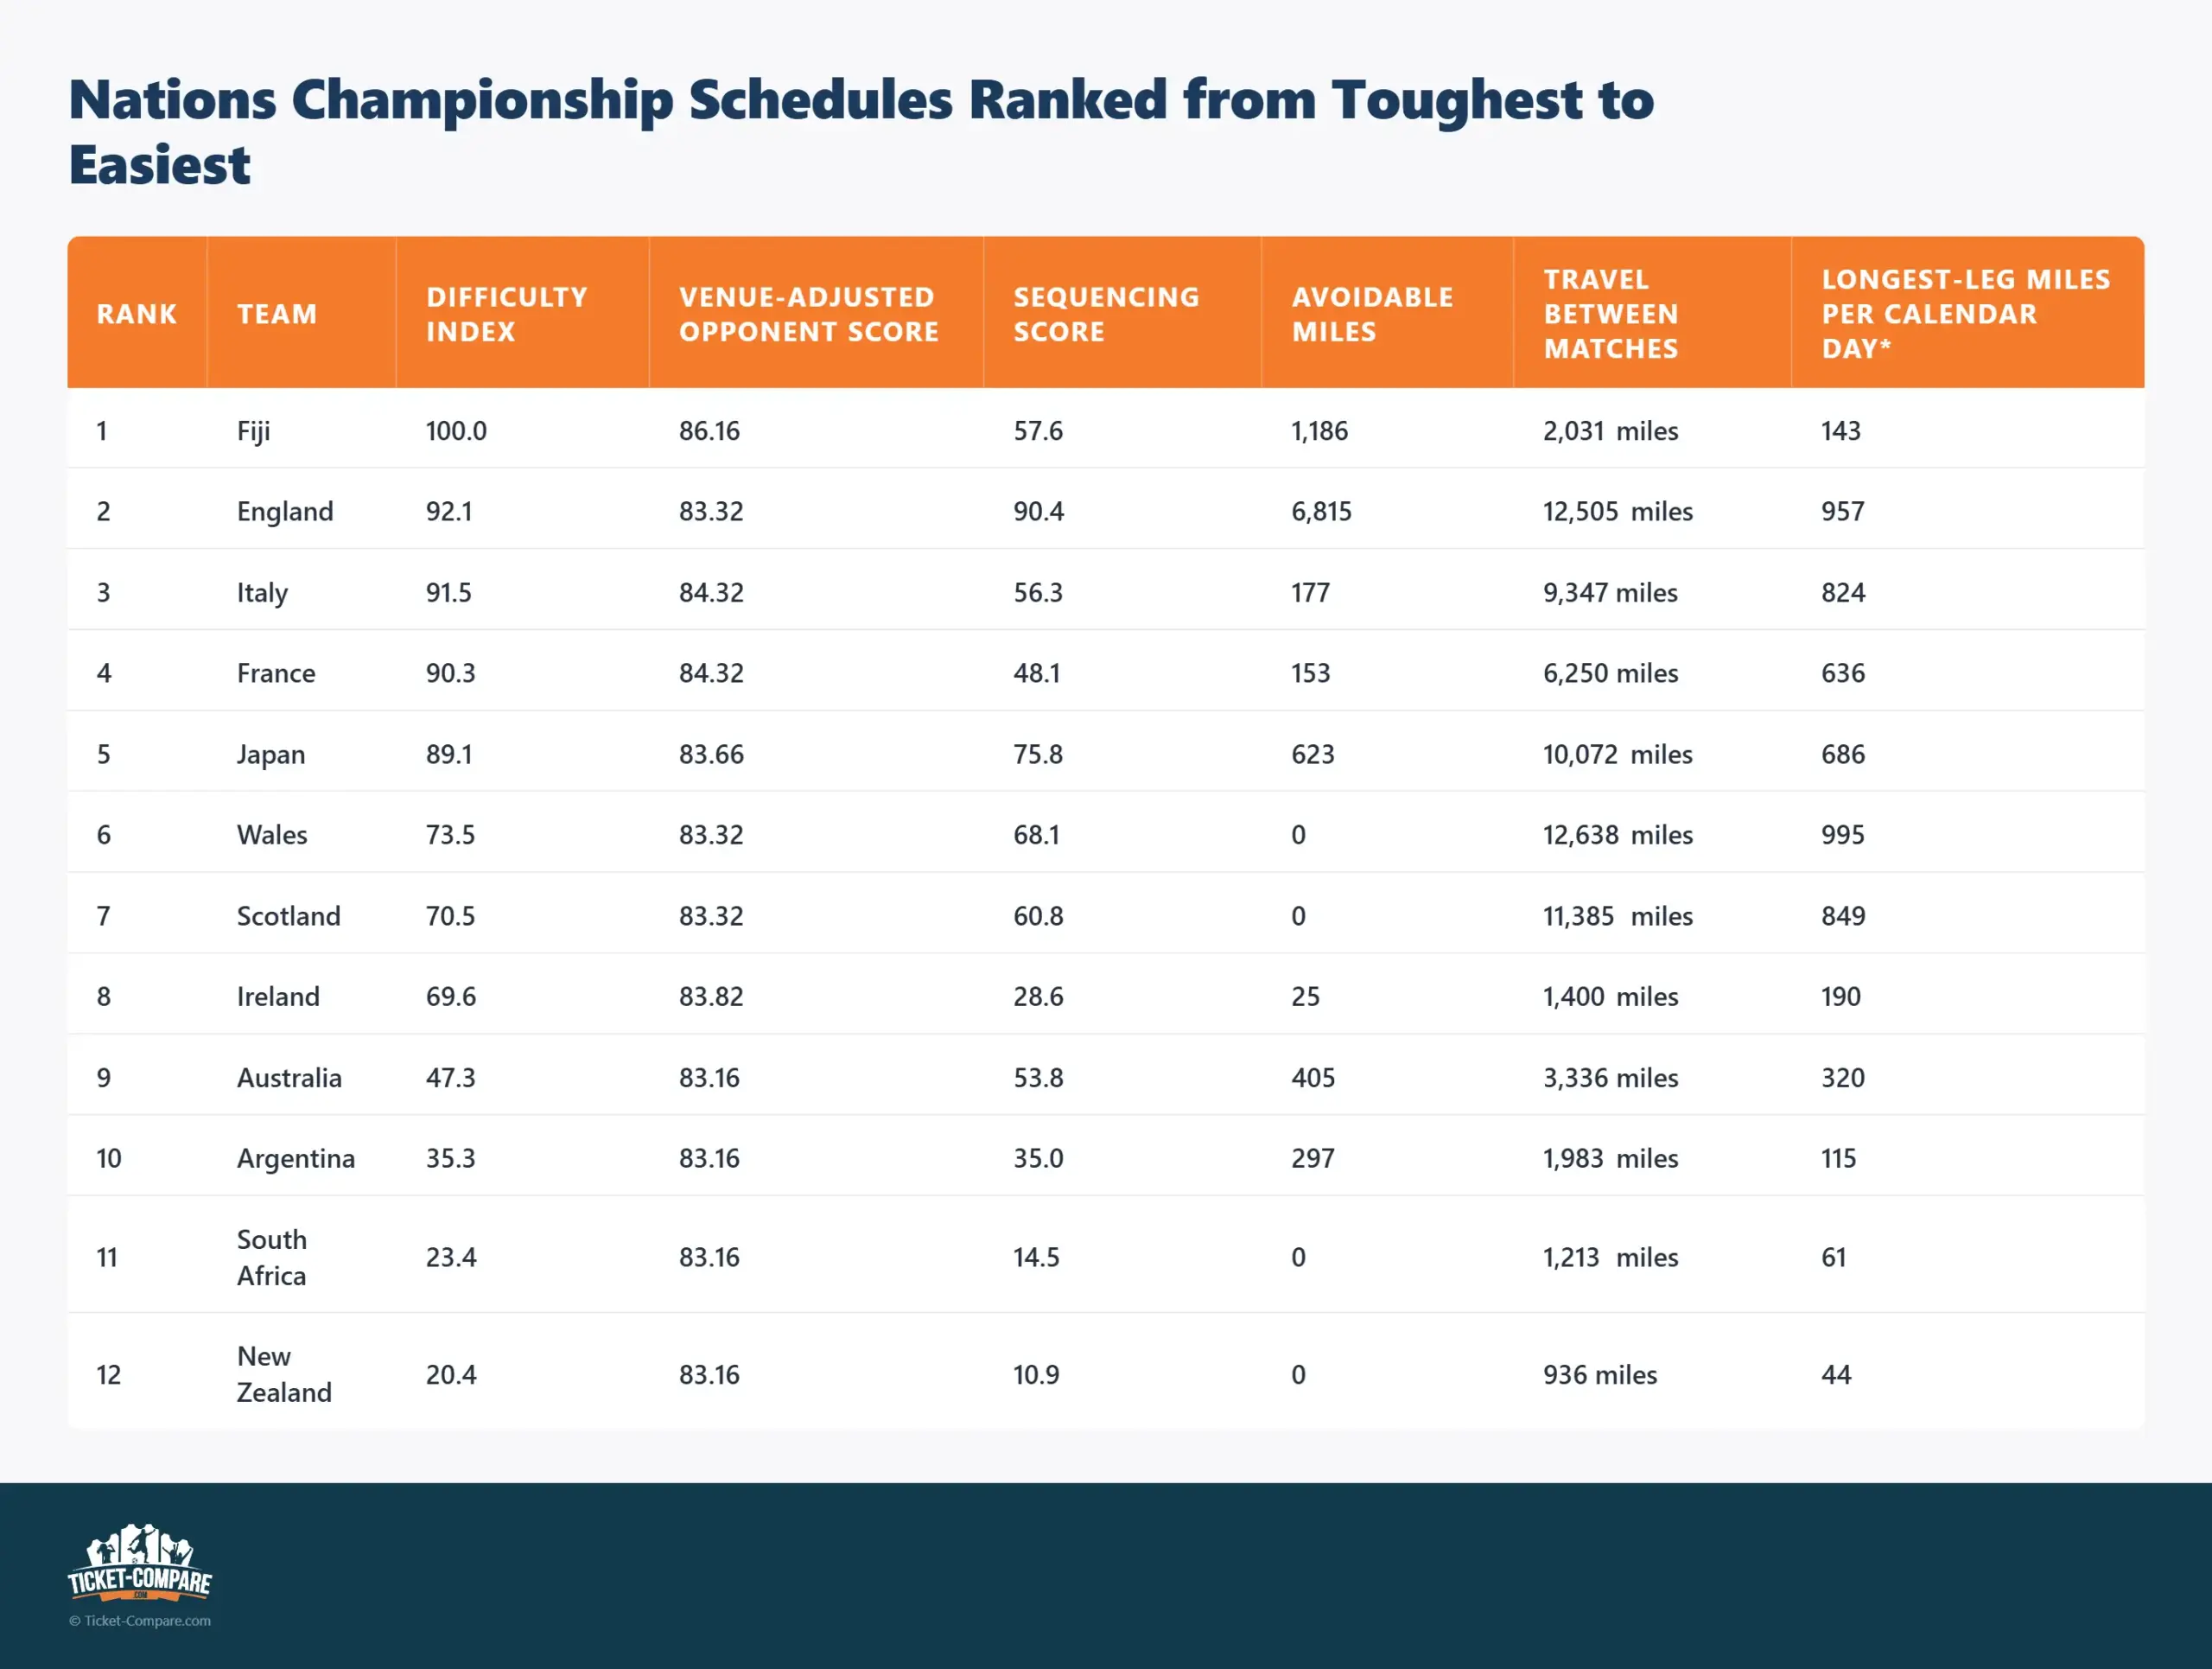
*The figure divides each team’s longest journey between consecutive fixtures by the number of calendar days between those matches. A higher figure indicates more travel over a shorter turnaround.
The Finals Weekend component depends on projected pairings, so the exact order of the leading group remains provisional.
The results produce a competitive leading group rather than one overwhelming outlier. All in, Fiji have the toughest tournament, but only 10.9 points separate them from fifth-placed Japan. England, Italy and France also finish within ten points of the top, although they arrive there for different reasons.
Fiji’s position sums up the unusual structure of their tournament. All six league fixtures are staged in Europe, thousands of miles from their usual home base, and they also have the highest venue-adjusted opponent score in the competition.
England record the highest sequencing score by a considerable margin. Their demanding July itinerary creates an estimated 6,815 avoidable miles, largely because they travelled from Johannesburg to Liverpool before crossing the Atlantic again for their next fixture in Argentina.
Wales produce another interesting result. Their route contains no theoretically avoidable mileage, but they still travel further between consecutive fixtures than any other country.
Ireland present the opposite case, facing relatively difficult opposition while following a far more coherent travel route.
At the other end of the table, South Africa and New Zealand benefit from efficient sequencing, limited travel between matches and lighter recovery demands. Their November fixtures are also concentrated within a comparatively compact European tour.
Finals Weekend Partly Even out the Schedule
Staging Finals Weekend in London provides some counterweight to the demanding three-Test July programmes encountered by the Northern Hemisphere teams.
England benefit most obviously. After travelling across three continents during the opening window, they play all three November fixtures at Twickenham before remaining at the same venue for the tournament finale.
Finals Weekend begins on 27 November, less than a week after the final round of league matches.[1]
The other Northern Hemisphere teams also finish comparatively close to London. The Southern Hemisphere sides are already touring Europe by November, so their final journey may not be especially long, but Finals Weekend extends a campaign spent away from their usual home base.
In fact, each Northern Hemisphere team and its final November opponent will leave from the same city before travelling to London.
The Northern Hemisphere advantage comes less from the final transfer itself and more from completing the November window at or close to home.[1]
The location does not completely equalise the schedules, but it does reduce some of the logistical disadvantage carried by the northern teams during July, particularly in England’s case.
Fiji face the toughest tournament overall
To pick one nation that has drawn the short straw in the Nations Championship format, Fiji would be the main candidates.
As a high-achieving smaller nation, they also sit awkwardly within a competition that has been criticised as a closed top tier. Emerging teams such as Georgia, Portugal and Samoa are placed in the Nations Cup, with no promotion route during the first two editions.[6]
Fiji’s very inclusion in the tournament comes with an obvious compromise, as none of their six championship Tests takes place in Fiji.
Their nominal home fixtures were staged in Cardiff, Liverpool and Edinburgh, followed by away games in Lyon, Dublin and Udine. Finals Weekend then adds a seventh match in London.[1]
This combination of tough opponents and two windows set thousands of miles from Fiji places them first in our difficulty ranking.
Their challenge is mainly down to geography and the structure of the tournament, rather than a particularly inefficient route between match venues, which accounts for only 2,031 miles in our calculation. That figure does not include the much longer journeys between Fiji and Europe.
England Have the Worst Fixture Sequence
England’s July itinerary, bouncing from Johannesburg to Liverpool to Santiago del Estero on three successive weekends, is an outlier in terms of scheduling demands.[1]
The matches took place on 4, 11 and 18 July, leaving only a week between each leg.
That sequence needed two consecutive intercontinental flights and, under our route assumptions, created approximately 6,815 avoidable miles compared with the shortest ordering of the same fixtures.
It illustrates the main quirk of the tournament, with a modern league format operating through a traditional and occasionally awkward touring calendar.
Of course, England’s later schedule does offer some compensation.
All three November fixtures and their Finals Weekend match are staged at Twickenham, although that home finish does not counter the exceptional demands of their July schedule.[1]
Italy and France Combine Difficult Opponents with Demanding Tours
While neither France nor Italy encountered the same tortuous sequence as England, they rank highly in our index for other reasons.
Both combined testing away opposition with serious travel between venues and share the second-highest venue-adjusted opponent score in our calculation, behind Fiji.
France travelled from New Zealand to Australia and then Japan, while Italy went from Japan to New Zealand and Australia on three successive Saturdays.[1]
Ireland’s programme kept things more regional, with two matches in Australia followed by a final Test in New Zealand.
Wales Travel Furthest between Consecutive Fixtures
Wales are one of the more surprising results in the ranking.
Their July route was efficient in theory, but it still required enormous transfers from Cardiff to San Juan and then Durban on successive Saturdays.[1]
Those journeys measure approximately 6,967 and 5,672 miles respectively, giving Wales the highest total travel between consecutive matches at around 12,638 miles.
Wales’ epic cross-Atlantic journey shows why avoidable mileage is a big factor, but not the sole measure of a difficult Nations Championship schedule.
Even with the most efficient ordering of their three match locations, they would have faced one of the tournament’s most demanding itineraries.
Japan’s Neutral Fixture Creates Another Unusual Itinerary
Another quirk of the schedule saw Japan’s nominal home match against Ireland staged at McDonald Jones Stadium in Newcastle, Australia. That’s before we mention the decision to consider the Brave Blossoms a Southern Hemisphere team.[1]
Their home match away from home fell between genuine home fixtures against Italy and France in Tokyo, requiring Japan to travel from Japan to Australia and back again on consecutive weekends.
That detour produced approximately 9,609 miles of travel between their July matches, despite all three Tests being classed as Japanese “home” fixtures.
It certainly helps explain Japan’s high sequencing score of 75.8 and adds an important wrinkle to our difficulty index.
The Most Demanding July Itineraries
The July window shows why total mileage and fixture sequencing need to be considered separately.
England did not travel furthest between matches, but the order of their fixtures created far more avoidable mileage than any other team.
Wales followed the most efficient possible route between their three venues, yet still faced the greatest match-to-match distance.
Japan provide another unusual case as, despite officially hosting all three July fixtures, their neutral match against Ireland in Australia required a return journey of around 9,600 miles between Tests.
Ireland, by comparison, took on a demanding overseas programme but benefited from a much more coherent route across Australia and New Zealand.

Let’s look a little at the contrast between England and Wales, which is particularly revealing.
Wales cover slightly more ground between matches, but their venues already form the shortest practical sequence.
England’s route is different because the Liverpool fixture sits between visits to South Africa and Argentina.
Reordering the same three locations could theoretically have reduced England’s travel by approximately 6,815 miles.
Ireland’s three July matches still took place thousands of miles from home, but Sydney, Newcastle and Auckland form a compact regional itinerary compared with the routes faced by the other Northern Hemisphere teams.
This helps explain why Ireland rank relatively highly for opponent difficulty but much lower for sequencing.
Which Teams Have the Easiest Nations Championship Schedules?
“Easy” is a relative term, as every team takes on six major internationals followed by Finals Weekend.
However, shorter transfers, efficient fixture sequencing and less disrupted movement across time zones leave some countries with fewer logistical obstacles.
The four SANZAAR teams occupy the bottom four places in our Difficulty Index, with Australia followed by Argentina, South Africa and New Zealand.
Their low scores come mainly from travel and sequencing rather than weaker opposition, as all six teams in the Southern Hemisphere group face the same Northern Hemisphere opponents.
South Africa and New Zealand also entered the tournament ranked first and second in the world, while Argentina were fifth.[5]
That strengthens their prospects on the pitch, although it is separate from the difficulty of the schedule itself.
The four teams follow relatively compact European routes in November. South Africa travel through Turin, Paris and Dublin, while New Zealand visit Edinburgh, Cardiff and London.
Argentina play in Dublin, Genoa and Paris, and Australia move between London, Edinburgh and Cardiff before all four continue to Finals Weekend.[1]
Could Travel and Recovery Affect the Results?
Long-haul flights, jet lag, limited preparation time and repeated changes in time zone and climate could all inhibit performance at the highest level.
A 2025 study involving professional rugby union players found that overnight long-haul travel substantially reduced sleep and temporarily impaired reactive jump strength, with the researchers recommending arrival more than three days before competition where possible.[7]
England and Wales each covered more than 12,500 miles between their July fixtures in our calculation, compared with just 1,400 miles for Ireland.
Northern Hemisphere teams with more coherent tours, or Southern Hemisphere sides with lighter November itineraries, may therefore gain a small but meaningful advantage over their rivals.
We would not go as far as claiming that travel will determine results.
Instead, the tournament’s logistical oddities create additional challenges alongside more established factors such as form, injuries and squad strength.
Is the Nations Championship Format Sustainable?
By adding meaning to the July and November touring windows, the Nations Championship also exposes a few difficulties in converting those matches into a formal global league.
Future editions could improve the sequencing without removing the international character that makes this tournament distinctive.
Some of the imbalance in 2026 is eased by staging Finals Weekend in London, particularly for England and the other Northern Hemisphere teams.
That benefit may not apply in the same way to every edition, depending on where future Finals Weekends are held.
The Guardian has reported that Qatar was awarded hosting rights for the 2028 and 2032 Finals Weekends.[8]
Analysing the 2026 Nations Championship, England’s July itinerary is the plainest example of a sequence that organisers may wish to avoid when planning future editions.
Conclusion: More than a Test of Rugby Ability
The Nations Championship is not only a test of squad quality, but also of each country’s ability to manage travel, recovery and an unusually irregular global schedule.
Our index puts Fiji as having the toughest all-round tournament, while England’s July itinerary stands out as the least efficient, creating an estimated 6,815 avoidable miles.
England’s burden is partly offset by playing all three November fixtures and their Finals Weekend match at Twickenham.
The four SANZAAR teams appear to benefit from home fixtures in July and more compact European routes in November.
That is the reality of rugby union’s answer to the Nations League, where the immense geographical scale of the competition could have a substantial influence on the final standings.
Methodology
The study is based on the official 2026 Nations Championship fixture list, including the three July rounds, three November rounds and Finals Weekend in London.[1] The data was compiled after the completion of the July window and should be viewed as a snapshot of the tournament at that point.
The seven components were weighted as follows:
Strength of opposition
Strength of opposition is based on the World Rugby ratings published immediately before the opening July round.[5]
As every team within one hemisphere faces the same six opponents, the main difference comes from where those matches are played. We therefore applied our own venue adjustment to distinguish between home, away and neutral fixtures.
The adjustment uses three rating points, matching the size of the home weighting previously used in the official World Rugby rankings. World Rugby removed that adjustment from its own rankings formula on 1 July 2026, partly because the Nations Championship includes nominal home fixtures played in neutral countries.[4]
Travel distances
All mileage figures use great-circle distances between host cities rather than actual flight paths. They therefore provide a consistent estimate of travel burden rather than a record of the precise routes flown by each team.
Designated home hubs were used at the beginning and end of each international window. Teams were assumed to return to their normal home hub between the July and November stages.
The model does not include airport transfers, ground travel, connecting flights, training camps or the different departure points of individual players.
Travel between matches
The travel-between-matches figure includes only the direct distance from the first match venue to the second, and from the second to the third, within each window.
It excludes the journey from the home hub to the opening fixture, the return journey after the third fixture and travel during the gap between July and November.
This is why Fiji record only 2,031 miles between match venues despite playing every league fixture thousands of miles from Fiji.
Avoidable mileage
Avoidable mileage measures the extra distance created by fixture sequencing.
For each team, we calculated the actual route from its home hub through the three match venues and back home. We then compared this with the shortest possible route through the same venues within that window.
The difference between the two totals is treated as avoidable mileage. The calculation does not suggest that fixtures could easily have been rearranged in practice, but it shows how much additional travel was created by their ordering.
England’s actual July route was approximately:
London to Johannesburg to Liverpool to Santiago del Estero to London
The shortest ordering of the same three match locations was approximately:
London to Johannesburg to Santiago del Estero to Liverpool to London
The difference between those routes was approximately 6,815 miles.
Recovery-adjusted travel
The longest-leg figure divides each team’s most demanding journey between consecutive fixtures by the number of calendar days between those matches.
For example, a 6,000-mile journey with seven days before the next Test produces a greater burden than a similar journey followed by a two-week break.
This is intended as a simple measure of travel intensity. It does not claim to calculate the actual number of full recovery or training days available to a squad.
Intercontinental travel and time zones
The index also counts direct intercontinental transfers between consecutive match venues.
Time-zone burden considers the total number of hours crossed and whether a team repeatedly changes direction.
A geographically coherent tour is therefore treated more favourably than a route that moves back and forth across several time zones.
Finals Weekend
The final 5% reflects the expected strength of each team’s Finals Weekend opponent and the journey to London after Round 6.
As the final pairings will depend on the November standings, this remains the most uncertain part of the index. The precise order of the leading teams should therefore be considered provisional until the Finals Weekend match-ups are known.
Each component was converted to a comparable scale before its weighting was applied. The highest combined score was then normalised to 100, with every other team scored relative to it.
The index measures the difficulty of the schedule on paper. It does not attempt to predict results or account for squad selection, form, injuries, charter arrangements or differences in how individual unions manage travel and recovery.
Sources
- ↑ a b c d e f g h i j k l m n o p The official Nations Championship fixture list sets out the six July and November rounds, host cities and match dates, while its Finals Weekend guide confirms the six rank-matched games at Allianz Stadium from 27 to 29 November.
- ↑ Reuters reported Ben Earl’s criticism of England’s “brutal” three-continent schedule and his suggestion that the matches could be staged within one host country.
- ↑ UEFA’s official guide to the 2026/27 Nations League confirms that its final tournament will again involve four teams.
- ↑ a b World Rugby confirmed that it would remove the three-point home weighting from its rankings formula from 1 July 2026, citing the changing venue arrangements in international rugby.
- ↑ a b World Rugby’s rankings update after the opening Nations Championship round confirms the positions of the leading teams and shows that Argentina entered the competition fifth before falling to seventh.
- ↑ World Rugby’s overview of the Nations Cup confirms its 12 participating unions, while the governing body’s calendar reform announcement states that promotion and relegation between the two divisions will begin from 2030.
- ↑ a b A peer-reviewed study indexed by PubMed examined the effects of overnight long-haul travel on sleep and physical and cognitive performance in professional male rugby players.
- ↑ The Guardian reported that Qatar had been awarded hosting rights for the Nations Championship Finals Weekends in 2028 and 2032, although the organisers had not issued a public confirmation.


