

 English












Which Premier League Teams Push Up Ticket Prices When They Visit?
Written by Alex Bird
Most fans who purchase match-by-match home tickets will be aware that Premier League clubs tend to charge different prices depending on who the visiting team is:
- A visiting team can almost triple the price of the same home seat
- The traditional Big Six still command the highest premiums when they are the away team
- In 2025/26, Liverpool were placed in the most expensive home-ticket category at all 18 grounds that varied prices by opposition
- At West Ham’s London Stadium, a Band 3 or 4 member ticket ranged from $36 to $107, a 196.3% increase, while at Arsenal, the maximum rise in price for the same seat was $116 [1]
In the 2025/26 season, 18 out of 20 clubs used some form of category system to differentiate pricing for Premier League tickets from one home fixture to the next.[2]
Across the competition, some visiting teams repeatedly appear in the highest pricing category, while others are more often placed in cheaper bands.
For the biggest games, these price spikes are often accompanied by stricter sales criteria, requiring an attendance history or loyalty points to qualify for tickets.
Following in-depth research assessing all 20 clubs’ tariffs, this article examines how each was treated as a visitor during the 2025/26 season.
Our study looks at both the category status afforded to each visiting team and the actual price difference attached to those categories. We should say early on that this study has nothing to do with away tickets, which remain capped at $40 league-wide.[3]
Instead, as visitors, which badge adds the most to the price of a home ticket? Did fans only come to see The Arsenal? Were West Ham massive everywhere they went?
Let’s find out.
2025/26 Premier League Visitor Premium Index
This table ranks clubs according to the additional adult home ticket price attached to their visit. It uses the fixture categories and adult member tariffs where applicable.
At each stadium the clubs visited, the cheapest Premier League fixture category was scored 0 and the most expensive 100. The categories in between were positioned according to the actual adult member ticket price.
Each visiting club’s final score is the average of those results across every ground that varied its prices according to the opposition.[4]
As you can see Liverpool pipped Arsenal to the top spot. The two clubs are separated by their respective fixtures at Brighton and Hove Albion, where the home match vs Liverpool was Category A+ while Arsenal was A.
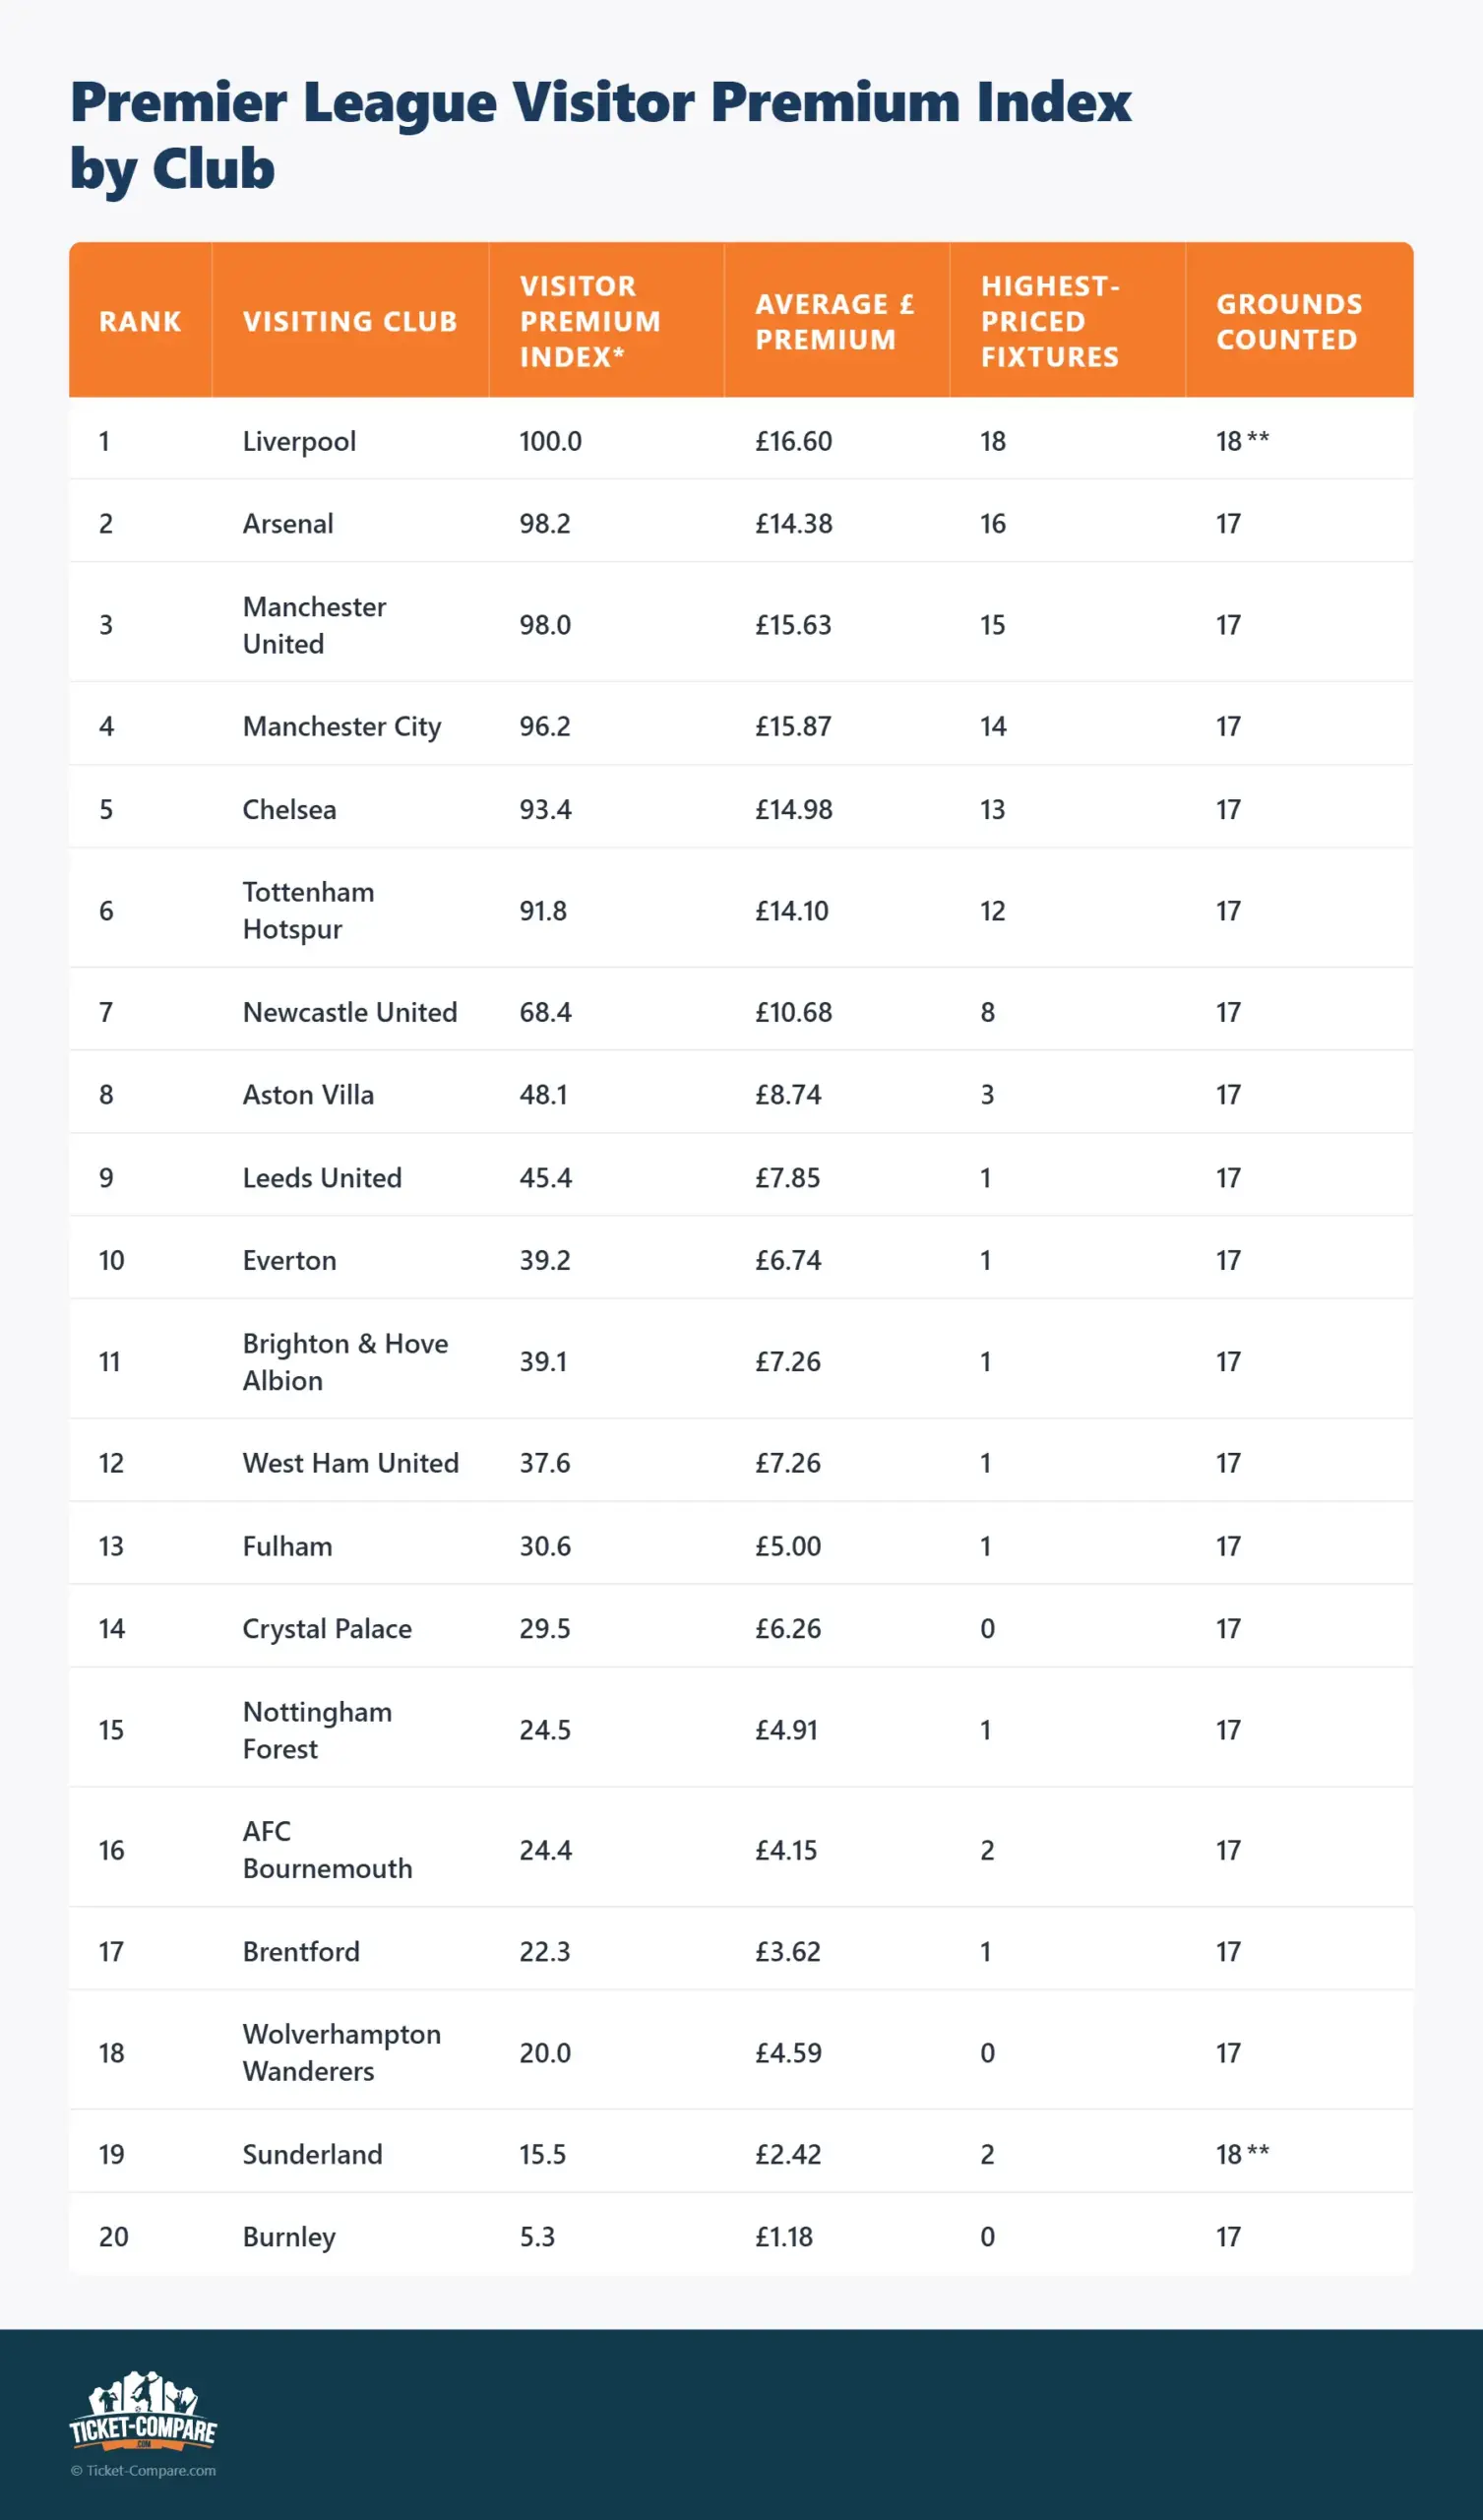
*The table is ranked by our Visitor Premium Index, not by the average pound figure.
**There was no variance in home prices for Sunderland and Liverpool tickets, so their home fixtures were excluded from the calculation rather than treated as zero-premium matches.
Both clubs remain fully included as visiting teams, based on the categories and prices applied to them elsewhere.
That is why Liverpool and Sunderland have 18 observations while most other clubs have 17: clubs cannot visit their own stadium, and the two blanket-pricing grounds provide no visitor-premium measurement.[5]
How the Visitor Premium Index Compared to the Final Premier League Table
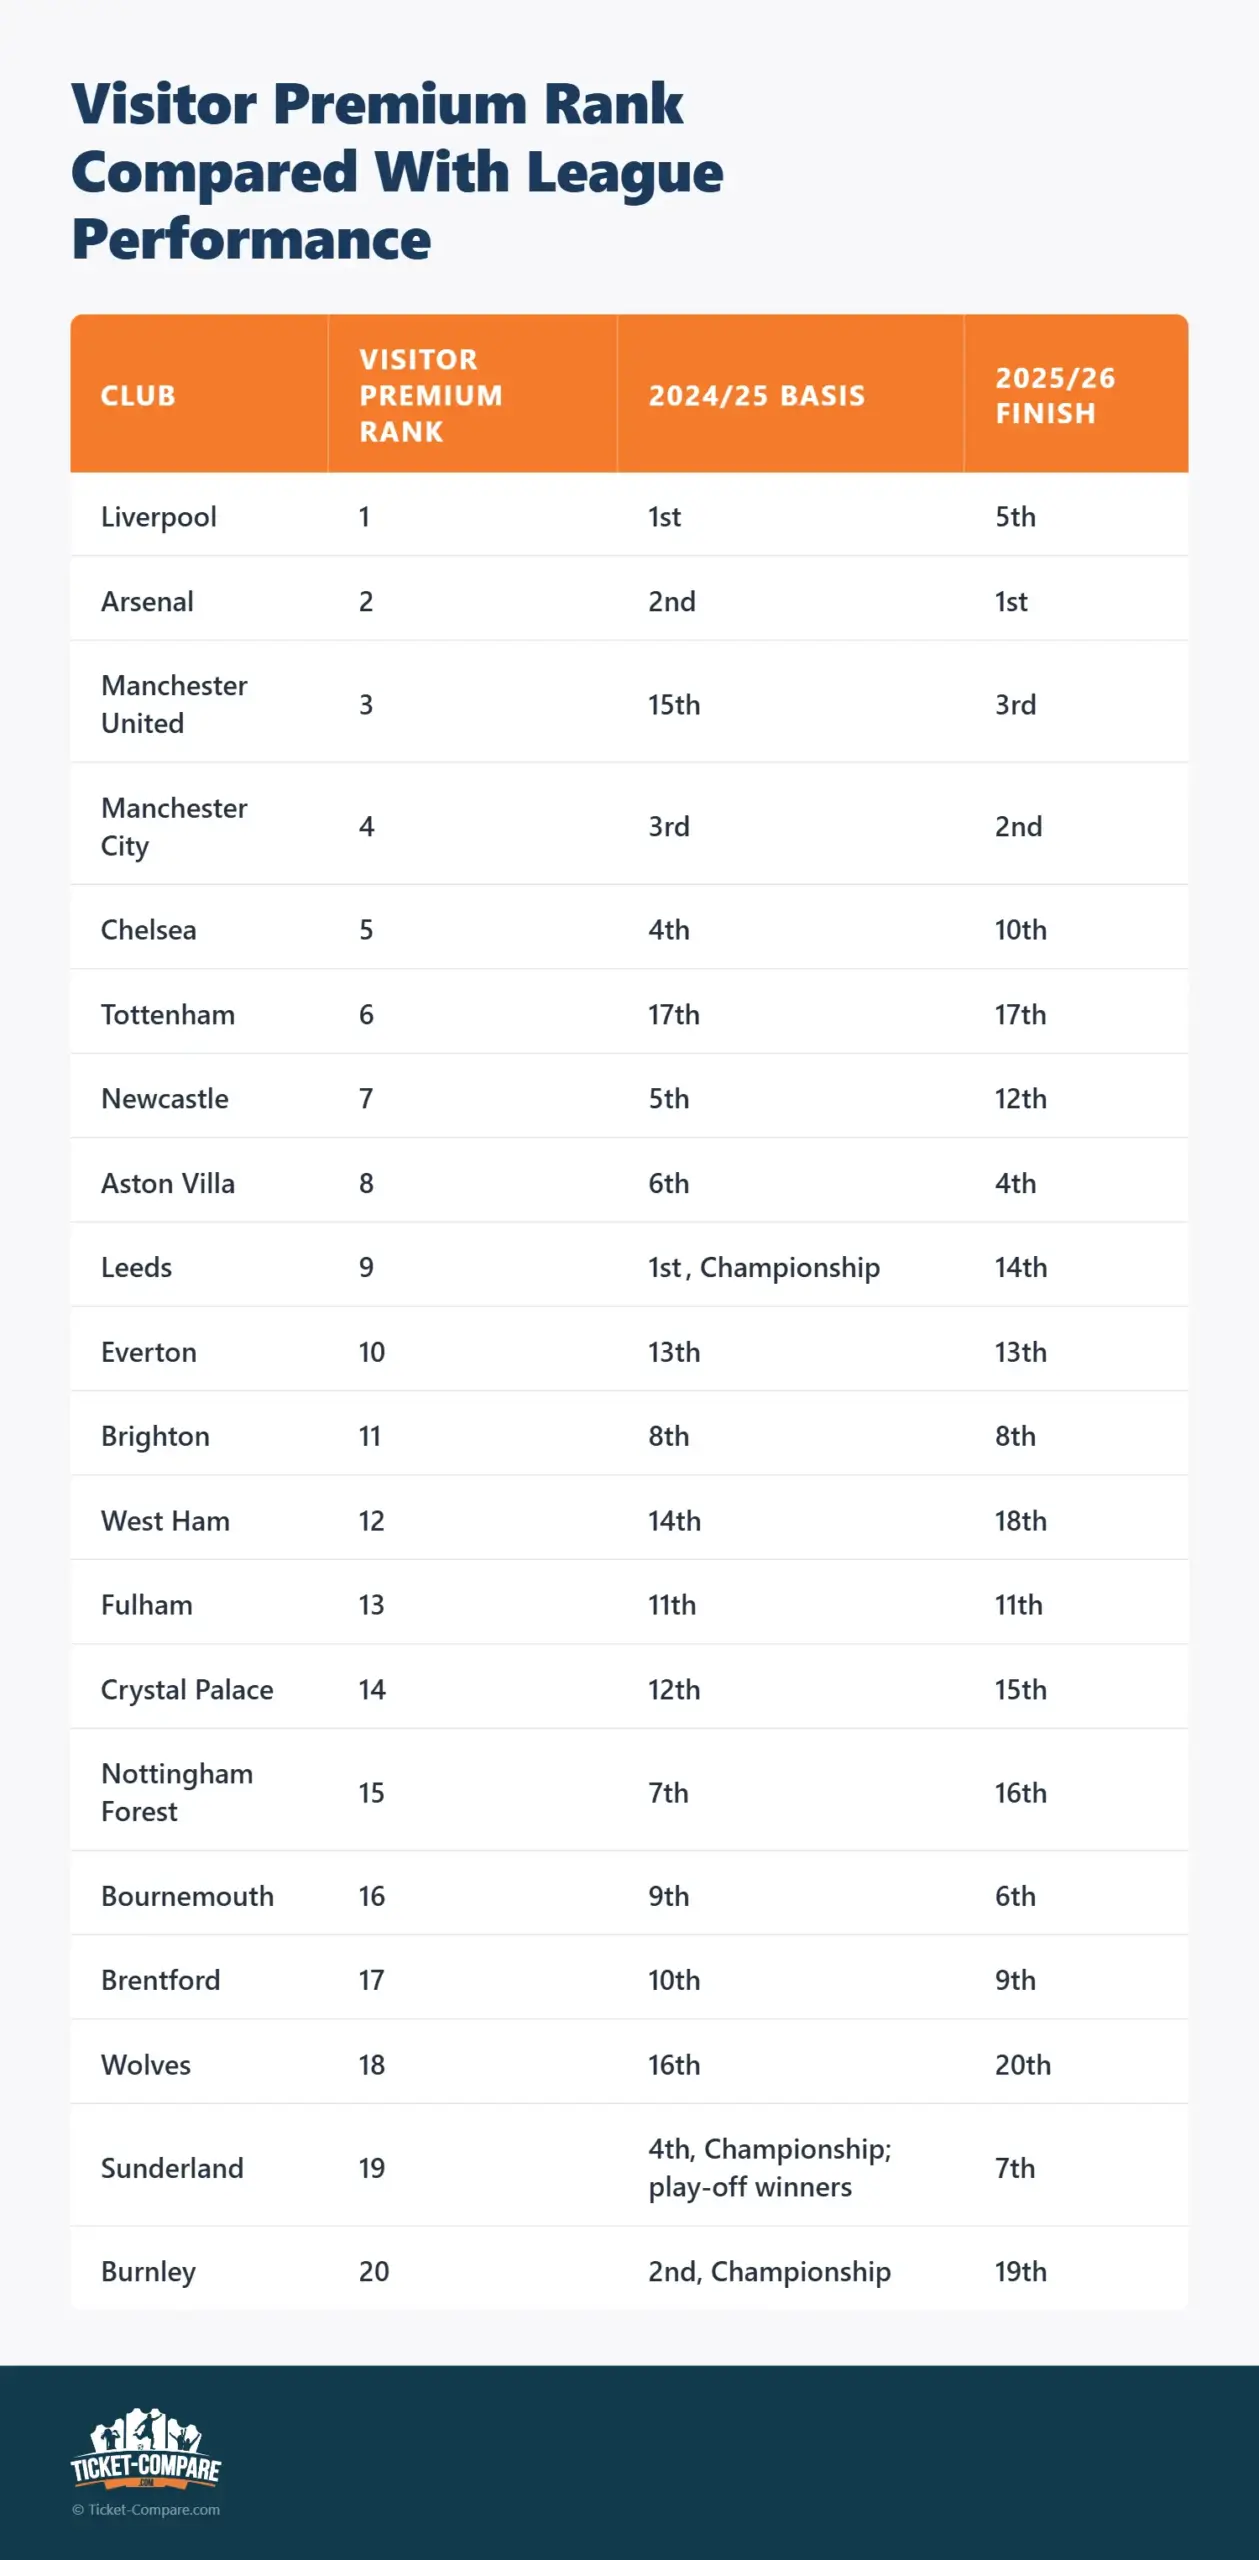
For context, Liverpool won the 2024/25 Premier League, followed by Arsenal, Manchester City and Chelsea, with Newcastle fifth and Aston Villa sixth.[6]
Leeds and Burnley earned automatic promotion from the Championship, while Sunderland came up through the play-offs.
The table made more sense in summer 2025 than it might look in hindsight
At the top, the index tracks the previous season quite closely:
- The reigning champions, Liverpool, were the most expensive visitors
- Second-placed Arsenal came second in the index
- Third-placed Manchester City and fourth-placed Chelsea remained within the most expensive five
- Newcastle and Aston Villa, who finished fifth and sixth, occupied seventh and eighth
That suggests that there was nothing arbitrary about Premier League pricing categories. Clubs were generally responding to a combination of recent sporting status and established supporter demand.
Manchester United and Tottenham are the real anomalies
The most revealing discrepancies between ranking and pricing could be seen before the 2025/26 season began:
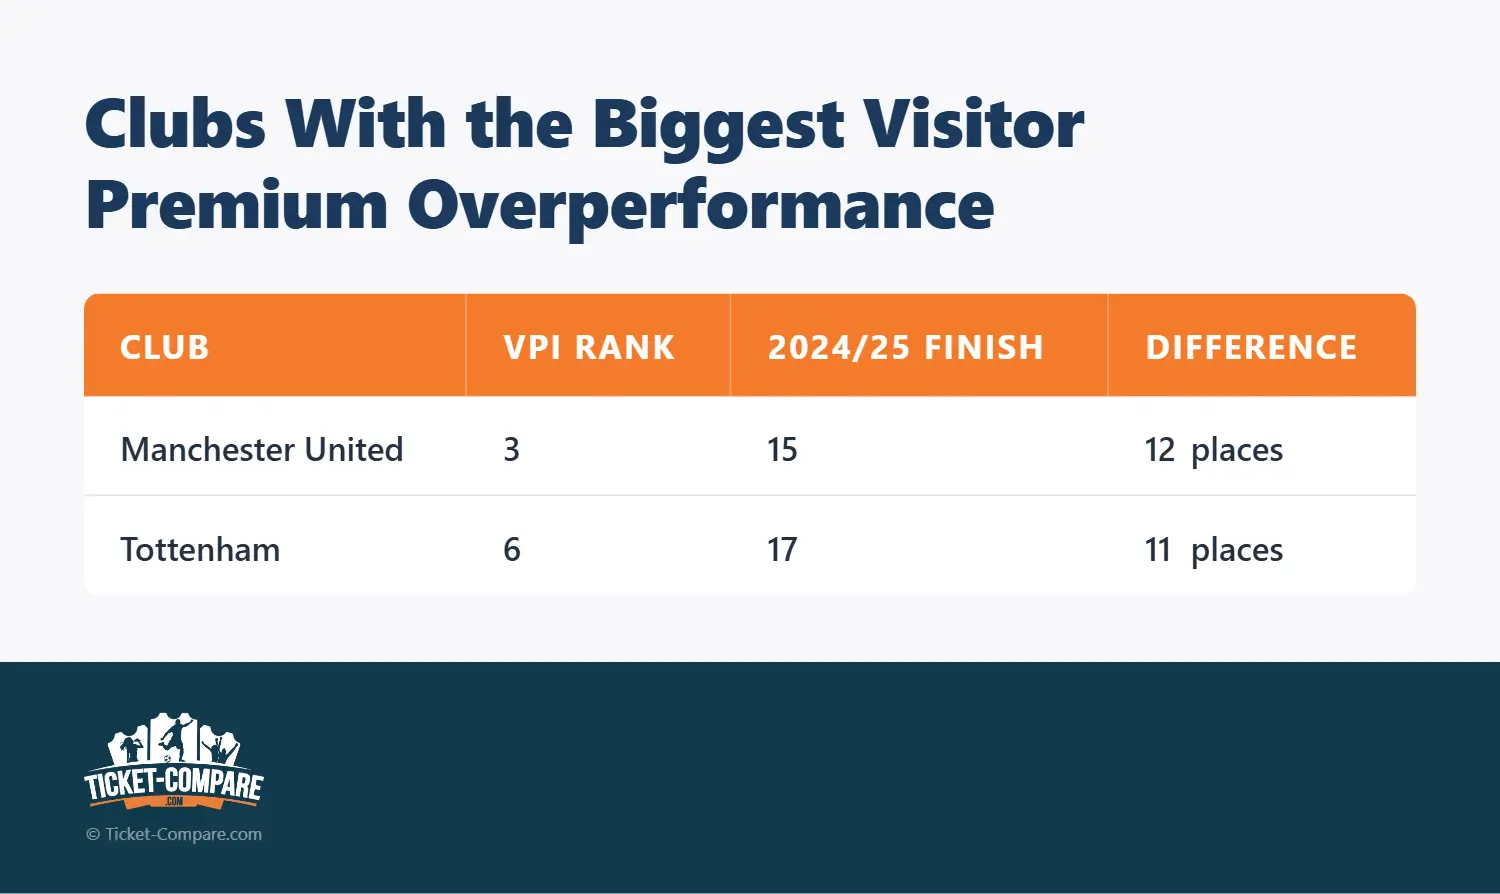
These are much stronger evidence of commercial reputation overriding immediate sporting performance than comparisons with the eventual 2025/26 table.
Manchester United had finished 15th, yet remained the third-most valuable visiting opponent. Tottenham had finished 17th, yet remained sixth. Both retained their established place within the ticketing Big Six despite historically poor seasons.[7]
This suggests:
Ticket categories respond to recent results, but not nearly as quickly as they respond to long-term club size, rivalries and supporter demand.
Manchester United’s recovery to third in 2025/26 makes their premium look prescient in hindsight. The likelier explanation is that their position was protected by their enormous inherited drawing power.
It cannot be a shock that the top three clubs in our Visitor Premium Index are the three most successful clubs in English league football history (20 titles each for Liverpool and Manchester United, and 14 for Arsenal).
Tottenham, by contrast, finished 17th again in 2025/26, giving us the biggest unresolved gulf between commercial status and performance.
Newcastle and Villa’s performances made a mark
Newcastle and Aston Villa ranked seventh and eighth after finishing fifth and sixth respectively in 2024/25, and achieving top-four finishes in 2023/24 and 2022/23.
That suggests their rise in status had registered. They were clearly separated from the bulk of the league, but neither had crossed into the traditional premium group.
The numerical gaps are striking:
- Tottenham in sixth: 91.8
- Newcastle in seventh: 68.4
- Aston Villa in eighth: 48.1
So Newcastle were 23.4 index points behind Tottenham, despite finishing 12 places above them in 2024/25. Villa were another 20.3 points behind Newcastle.
The index therefore shows not a smooth hierarchy but three distinct groups:
- The entrenched Big Six
- Newcastle as the nearest challenger
- Aston Villa and the rest
That may be one of the most interesting structural findings that we have come across.
Nottingham Forest’s 2024/25 overachievement did not register
Forest finished seventh in 2024/25 but ranked only 15th in the Visitor Premium Index—an eight-place deficit.
Bournemouth and Brentford showed a similar, though slightly smaller, pattern:
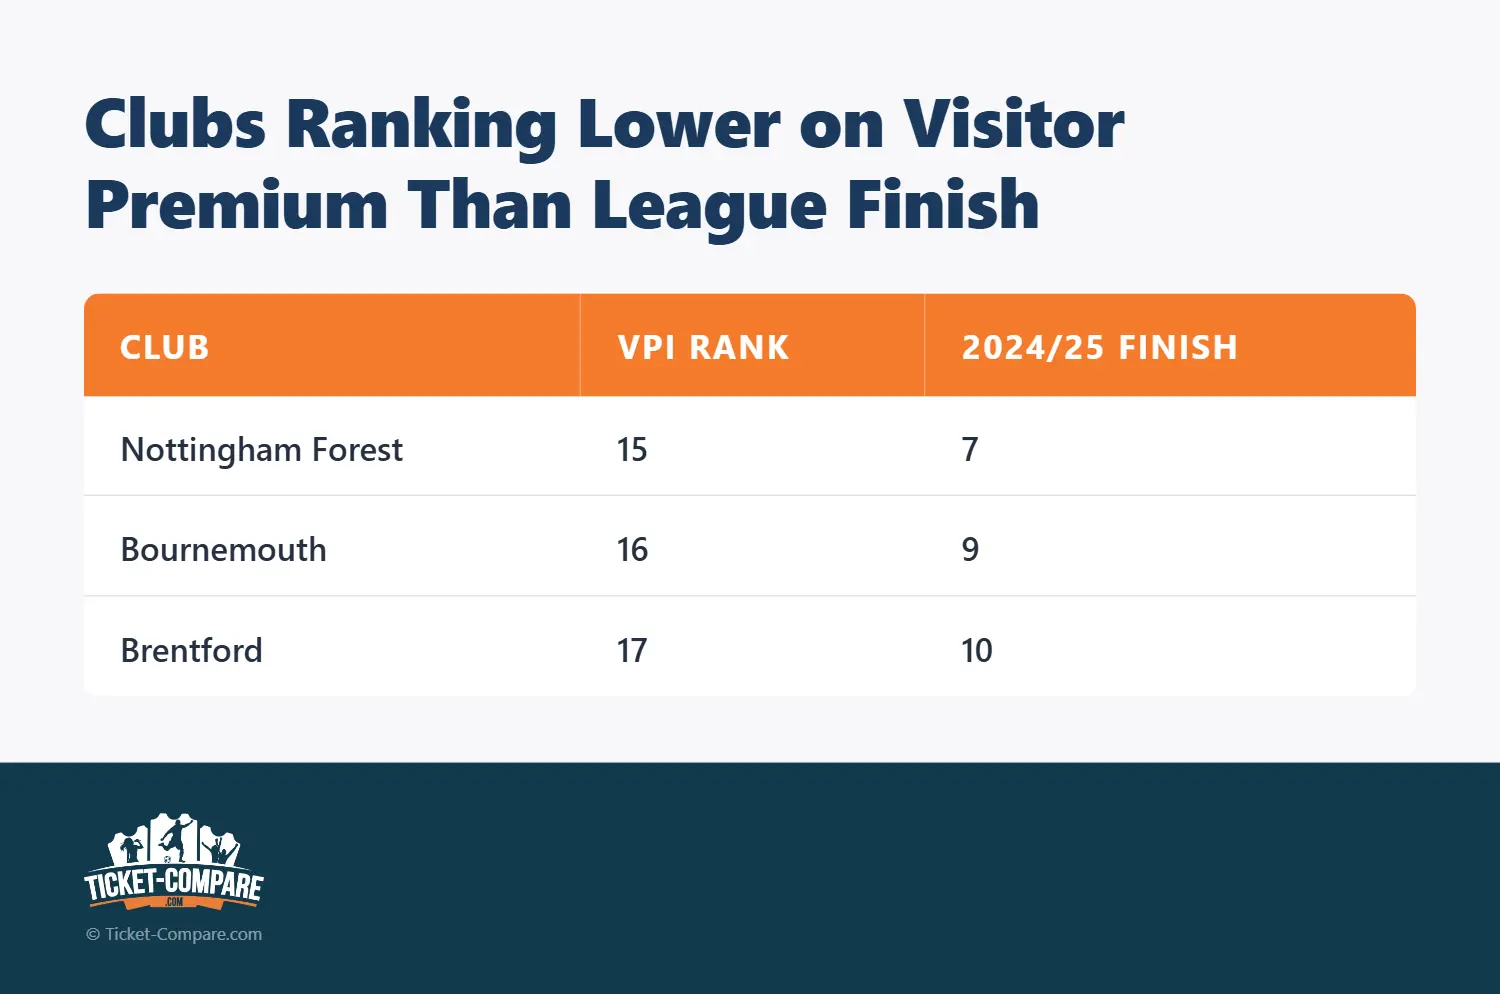
These clubs had performed strongly, but their results had not yet pushed the clubs into premium status.
Forest are particularly telling because seventh place was not merely a mid-table finish. Even so, clubs evidently did not expect Forest’s visit to generate demand remotely comparable with tickets for Manchester United or Tottenham.
The 2025/26 results then diverged:
Bournemouth rose further to sixth and Brentford finished ninth, while Forest dropped to 16th.
That means Bournemouth provide the strongest example of a club whose sporting trajectory continued to outrun its reputation in other spheres. Again, this can be explained by the club’s long-term history, only tasting top-flight football for the first time in 2015/16.
Leeds were not treated like an ordinary promoted club
By that same token, the promoted teams are highly revealing, although Championship positions should not be compared directly with Premier League positions.
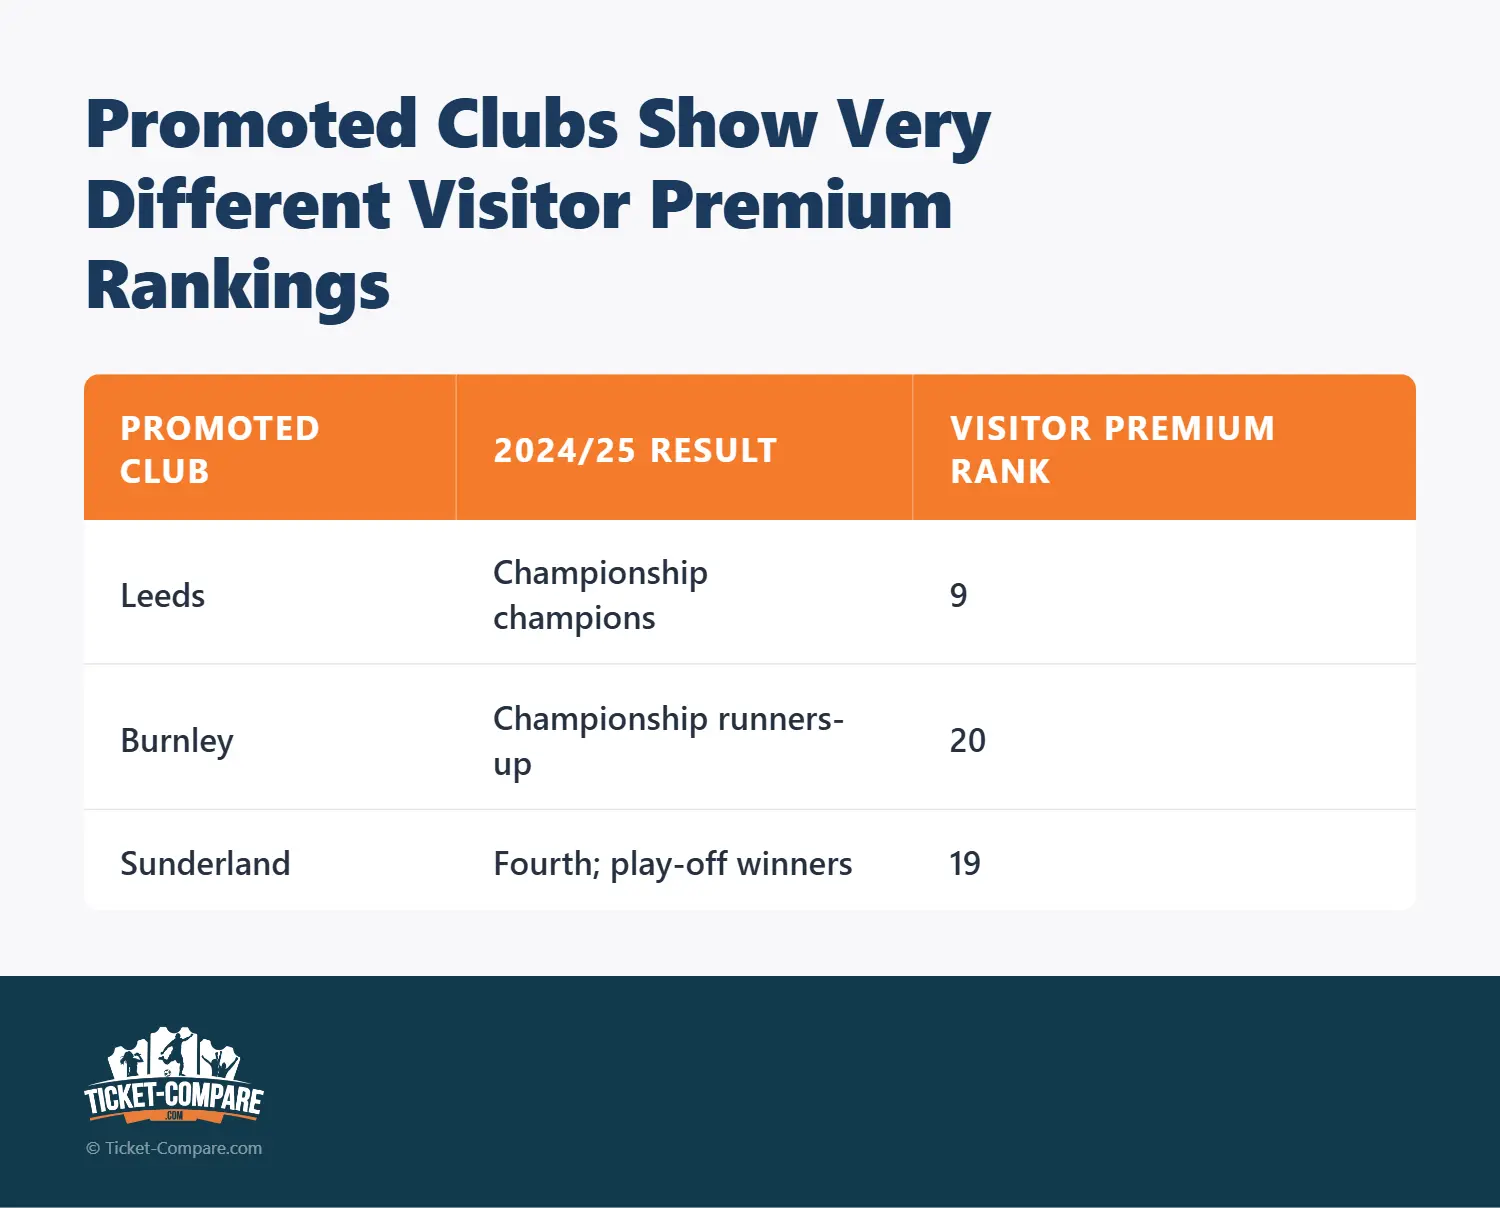
Leeds entered the Premier League as a higher-priced attraction than many established Premier League sides. The list includes Everton, Brighton, West Ham and Crystal Palace. Meanwhile Sunderland and Burnley entered at the bottom of the index.
This makes it difficult to argue that promoted clubs were graded primarily according to expected playing quality. Leeds and Burnley both finished on 100 Championship points, yet were separated by 11 positions in our visitor table.[8]
Leeds’ unusually large support, historical profile and established rivalries with teams like Manchester United and Chelsea appear to be the decisive factors here.
Along with the resilience of the Big Six, the promoted teams demonstrate that ticketing status is inherited as much as earned. Leeds returned as a top-half pull, while Burnley and Sunderland began close to the bottom.
Sunderland’s low ranking was reasonable at the time, even though it aged badly
Sunderland’s eventual seventh-place finish makes 19th in the Visitor Premium Index look dramatically low. But that is hindsight.
When clubs were setting prices, Sunderland were the Championship’s fourth-placed side and had only secured promotion through the play-offs. There was little basis for treating them as an elite sporting opponent before the season began.
As the league’s surprise package, Sunderland massively outgrew the status with which they entered the season.
Arsenal and Manchester United justified their premium status
The final 2025/26 table is most useful for showing which summer valuations were subsequently vindicated:
- Arsenal placed second in the index and became champions
- Manchester City placed fourth and finished second
- Manchester United placed third and finished third
- Aston Villa placed eighth and climbed to fourth
Arsenal’s title and United’s revival brought sporting performance back towards their premium pricing status. Villa continued moving in the opposite direction: their sporting achievements remained ahead of their commercial ranking.
Chelsea, Newcastle and West Ham fell below their summer billing
Other classifications made sense in summer 2025 but aged less well:
- Chelsea were graded fifth after finishing fourth, but subsequently dropped to tenth
- Newcastle were placed seventh after finishing fifth, but fell to 12th
- West Ham were ranked 12th after finishing 14th, but were relegated
- Liverpool were first after winning the title, then finished fifth
These can simply be read as seasonal underperformance relative to their established summer status.
Tottenham remain the most striking case
Tottenham are unusual because neither comparison explains away the premium:
- 17th in 2024/25
- Sixth in the Visitor Premium Index
- 17th again in 2025/26
Their continued top-six ticketing position cannot be justified by either league season. It rests primarily on longer-term factors like club size, London rivalries, supporter interest and established perceptions of the fixture.
That makes Tottenham the most obvious illustration of reputation lag—or perhaps resilience.
Miscellaneous Findings from Our Research
Largest cash difference for the same type of seat:
$116 at Arsenal. An adult upper-tier centre Arsenal ticket cost $79 for a Category C match and $195 for Category A. That is an increase of 146.6%, meaning the seat cost almost two-and-a-half times as much depending on the opposition.[9]
Largest percentage difference:
196.3% at West Ham. Applying the $7 Claret Member discount consistently, a Band 3 or Band 4 seat ranged from $36 for Category C to $107 for Category AA. The $71 increase meant that the same seating band was almost three times as expensive for matches vs Arsenal or Liverpool as it was for games against Brentford or Burnley. Using general-sale prices instead, the change was from $43 to $114: still a rise of 165.6%.[10]
Arsenal’s jump from Category B to A was bigger than most clubs’ entire pricing range. An upper-centre ticket rose from $112 for Category B to $195 for Category A, an increase of $82, or 73.2%. Among the clubs for which a fully matched seating tariff is available, that single step exceeded the complete cheapest-to-dearest opposition difference everywhere else, including West Ham’s maximum $80 gap.[11]
A middle category could be almost the top price, or much closer to the bottom. In Crystal Palace’s Zone 5, Category B cost $82, compared with $84 for A and $62 for C. It therefore represented 88.2% of the full A-to-C premium. At Arsenal, a lower-tier behind-goal Category B ticket cost $60, between $104 for A and $43 for C, representing only 28.1% of the full premium. This is a useful demonstration of why the table weights categories by their actual prices instead of automatically giving every middle category 50 points.[12]
Fulham operated the most granular opposition-pricing system. Its Premier League fixtures fell into five distinct adult price tiers, from $56 to $114 for the seat we monitored. West Ham and Brighton used four price levels; nine clubs used three; and six used two. Liverpool and Sunderland were the only clubs found not to vary ordinary home prices according to the opposition.[13]
Liverpool’s average visitor premium was nearly 14 times Burnley’s. Across the categorising grounds, Liverpool added an average of $22 to the selected adult ticket compared with the cheapest fixture at each stadium. As visitors, Burnley added only $2. The difference was $20 per ticket, while Liverpool were placed in the highest-priced category at all 18 applicable grounds.[14]
How Our Visitor Premium Index Works
Let’s go into a bit more detail.
Almost every Premier League club used different category names and charged very different prices, so simply flicking through the league and counting Category A appearances would not necessarily give us a fair comparison.
So to keep things on an even keel, at each stadium, we compared the price of the same type of standard adult ticket across its Premier League fixture categories:
- The cheapest category was scored 0
- The most expensive category was scored 100
- Any category in between was scored according to its actual position between those two prices
For example, Bournemouth charged $47 for its cheapest category, $56 for Category B and $60 for Category A in the North and South Stands.
A Category B visitor therefore scored 70 at Bournemouth, because its $9 premium represented 70% of the full $13 difference between the cheapest and most expensive fixtures.
Each club’s final score is the average of its results across all grounds that used opponent-based pricing.
To break that down in the simplest terms:
A score of 100 means a club was always placed in the most expensive fixture category. A score of zero would mean it was always placed in the cheapest.
What the other columns mean
- Average £ premium is the average amount added to the selected adult ticket compared with that stadium’s cheapest fixture category. It does not show the average price of attending that club’s away matches. It isolates the extra amount attributable to the opposition.
- Highest-priced fixtures records the number of grounds where the visiting club was assigned the most expensive available adult tariff.
- Grounds counted shows the number of categorising clubs included in the calculation.
What ticket prices were included?
The comparison uses a standard adult general admission price that could be followed consistently across every category at each stadium.
Where possible, this was the same seating area rather than the headline minimum or midpoint of a broad stadium-wide range.
The calculation excludes:
- Hospitality and premium packages
- Restricted-view seats
- Family-area prices where appropriate
- Accessible companion prices
- Temporary promotions
- Booking fees
- Away section prices
Conclusion
The Visitor Premium Index broadly reflected the Premier League hierarchy as it stood in summer 2025.
Within that, we could see a substantial reputational premium for Manchester United and Tottenham, and a delay in recognising emerging clubs such as Nottingham Forest and Bournemouth.
One conclusion is that there’s a resilience to Big Six status that goes beyond on-field performance.
Over the following season, Arsenal and Manchester United justified their premium billing, Sunderland and Bournemouth dramatically outgrew theirs, and Tottenham remained the most obvious example of commercial status surviving poor results.
Ticket categories are not a live ranking of the Premier League’s best teams. They are a slower-moving measure of perceived demand, combining last season’s results with years—or even decades—of accumulated reputation.
Sources and Methodology
Methodology note
This section records the calculation rules, price inputs, evidence hierarchy and club-by-club sources used to construct the Visitor Premium Index. It is included so that the study can be checked and reproduced.
Research was checked up to 7 July 2026.
Scope of the study
The study covers the 20 clubs in the 2025/26 Premier League and asks how each was treated when visiting the other clubs.
It concerns ordinary home tickets sold to home supporters, not the away allocation, which remained subject to the Premier League’s $40 cap.
Each categorising home club contributed one observation for each visiting opponent. A club could not provide an observation for its own visit.
Liverpool and Sunderland were excluded as home-club observations because the evidence indicated that their ordinary 2025/26 home tariffs varied by seating location but not by opposition. They remained fully included as visiting teams.
The index does not weight clubs by stadium capacity, the number of match tickets made available or the number actually sold. Each applicable home club therefore has equal influence on a visitor’s final index score.
Evidence hierarchy
Sources were assessed in the following order:
- Official full-season ticket tariffs and category guides.
- Official fixture-specific sales announcements naming the category or displaying the price.
- Direct written correspondence from a club.
- Official ticketing portals, archived pages and search-indexed copies of pages that were no longer available in full.
- Reputable contemporary reporting and supporter-maintained records where the club had not preserved the information publicly.
- Reconstruction from exact price “fingerprints”, where a surviving fixture price could be matched to one category and no other.
Where a fixture assignment was reconstructed rather than explicitly stated by the club, that is identified in the limitations and club-source notes below.
Price basis
The preferred benchmark was the adult member price for the same ordinary general-admission seat, zone or seating band across every Premier League category used at that stadium. Where no separate member tariff existed, the standard adult price was used.
The annual cost of becoming a member was not included. Membership is not a fixture-specific charge, and including it would require assumptions about how many games a supporter attended.
The calculation excluded hospitality, premium-seat products, restricted views, family-only areas, accessible companion prices, away-section prices, booking fees, temporary promotions and reactive category changes introduced after the original pricing structure had been established.
Where a complete matched-seat tariff was unavailable, the most comparable surviving adult price sequence was used and the limitation is stated below.
Calculation
For each applicable home club:
- Fixture score = (price for the visitor’s category − price of the cheapest Premier League category) ÷ (price of the most expensive Premier League category − price of the cheapest Premier League category) × 100
- The cheapest category at that ground therefore scored 0 and the most expensive scored 100. Intermediate categories were positioned according to their actual prices rather than being assumed to sit at equal intervals.
- Visitor Premium Index = the mean of that visiting club’s fixture scores across all applicable grounds.
- Average £ premium = the mean of the price for that visitor’s category minus the cheapest category price at the same ground.
- Highest-priced fixtures = the number of applicable grounds at which the visitor received the maximum score of 100.
Index figures were rounded to one decimal place and average pound premiums to two decimal places. Rankings were determined from the unrounded Visitor Premium Index, not from the average pound premium.
Worked example
Bournemouth’s North and South Stand adult prices were $47 for Category C, $56 for Category B and $60 for Category A.
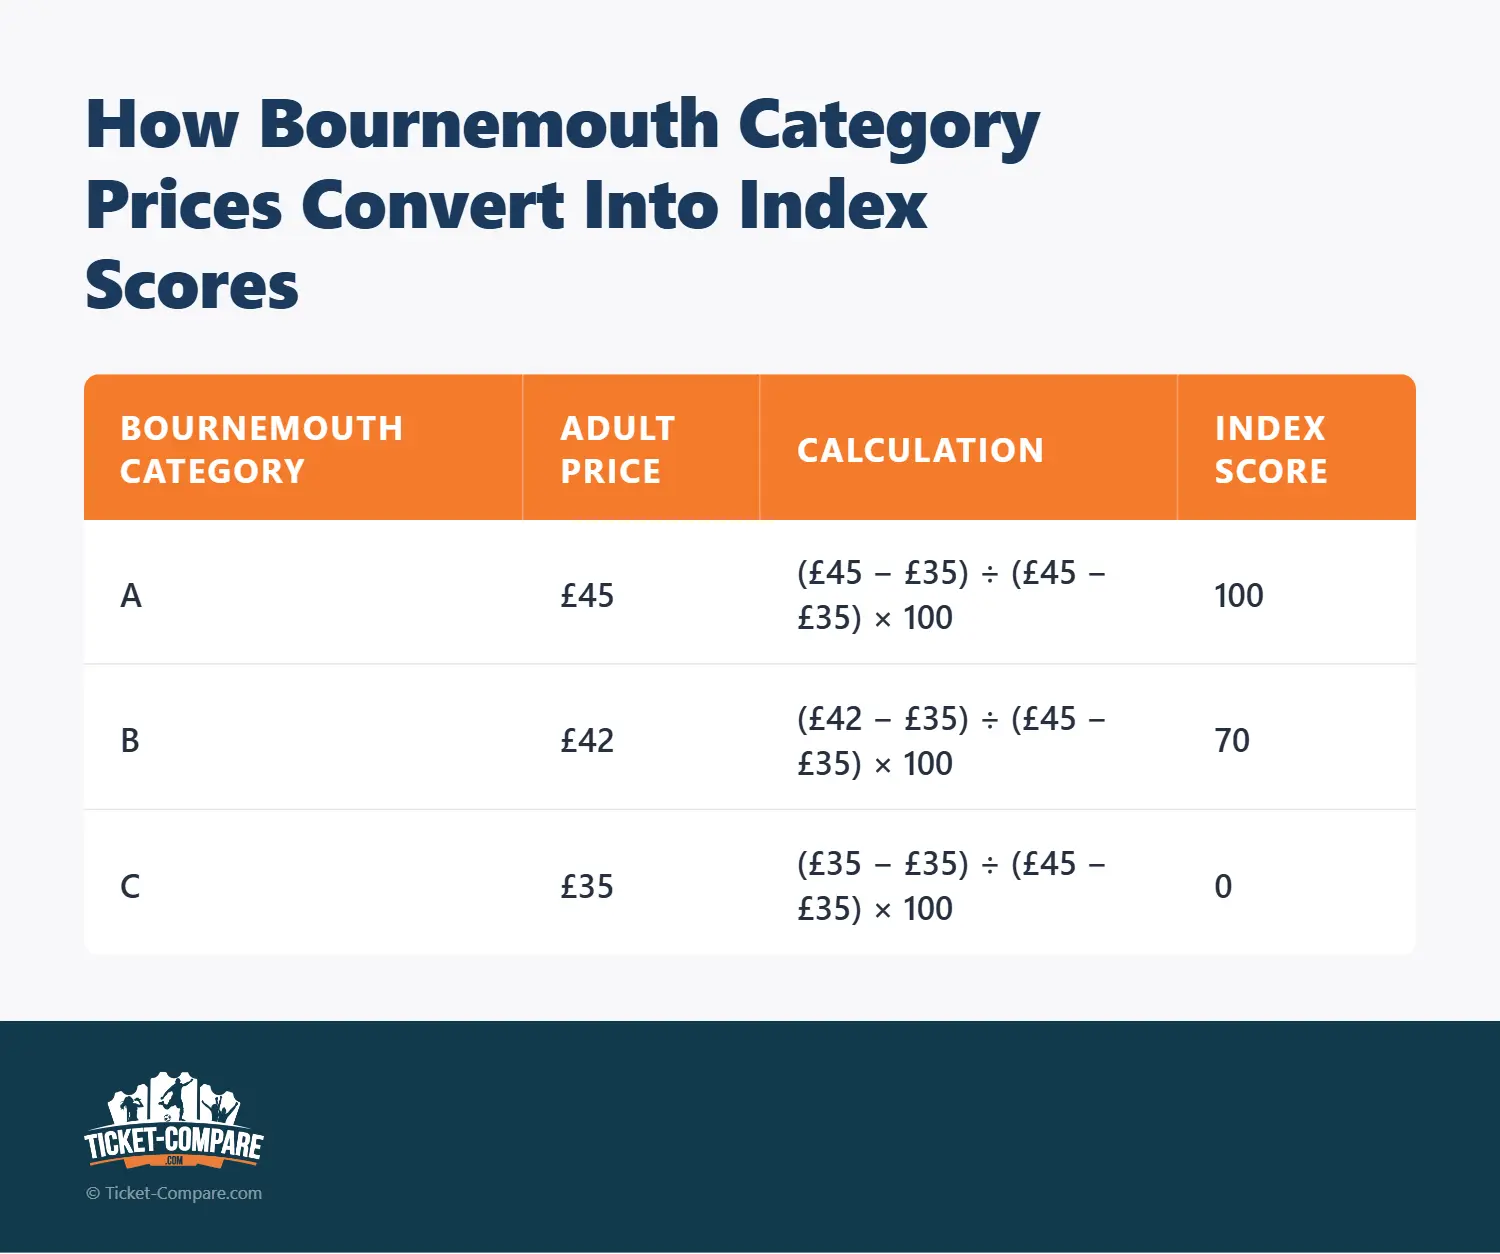
This is why a middle category did not automatically receive 50 points. Its score depended on the amount actually charged.
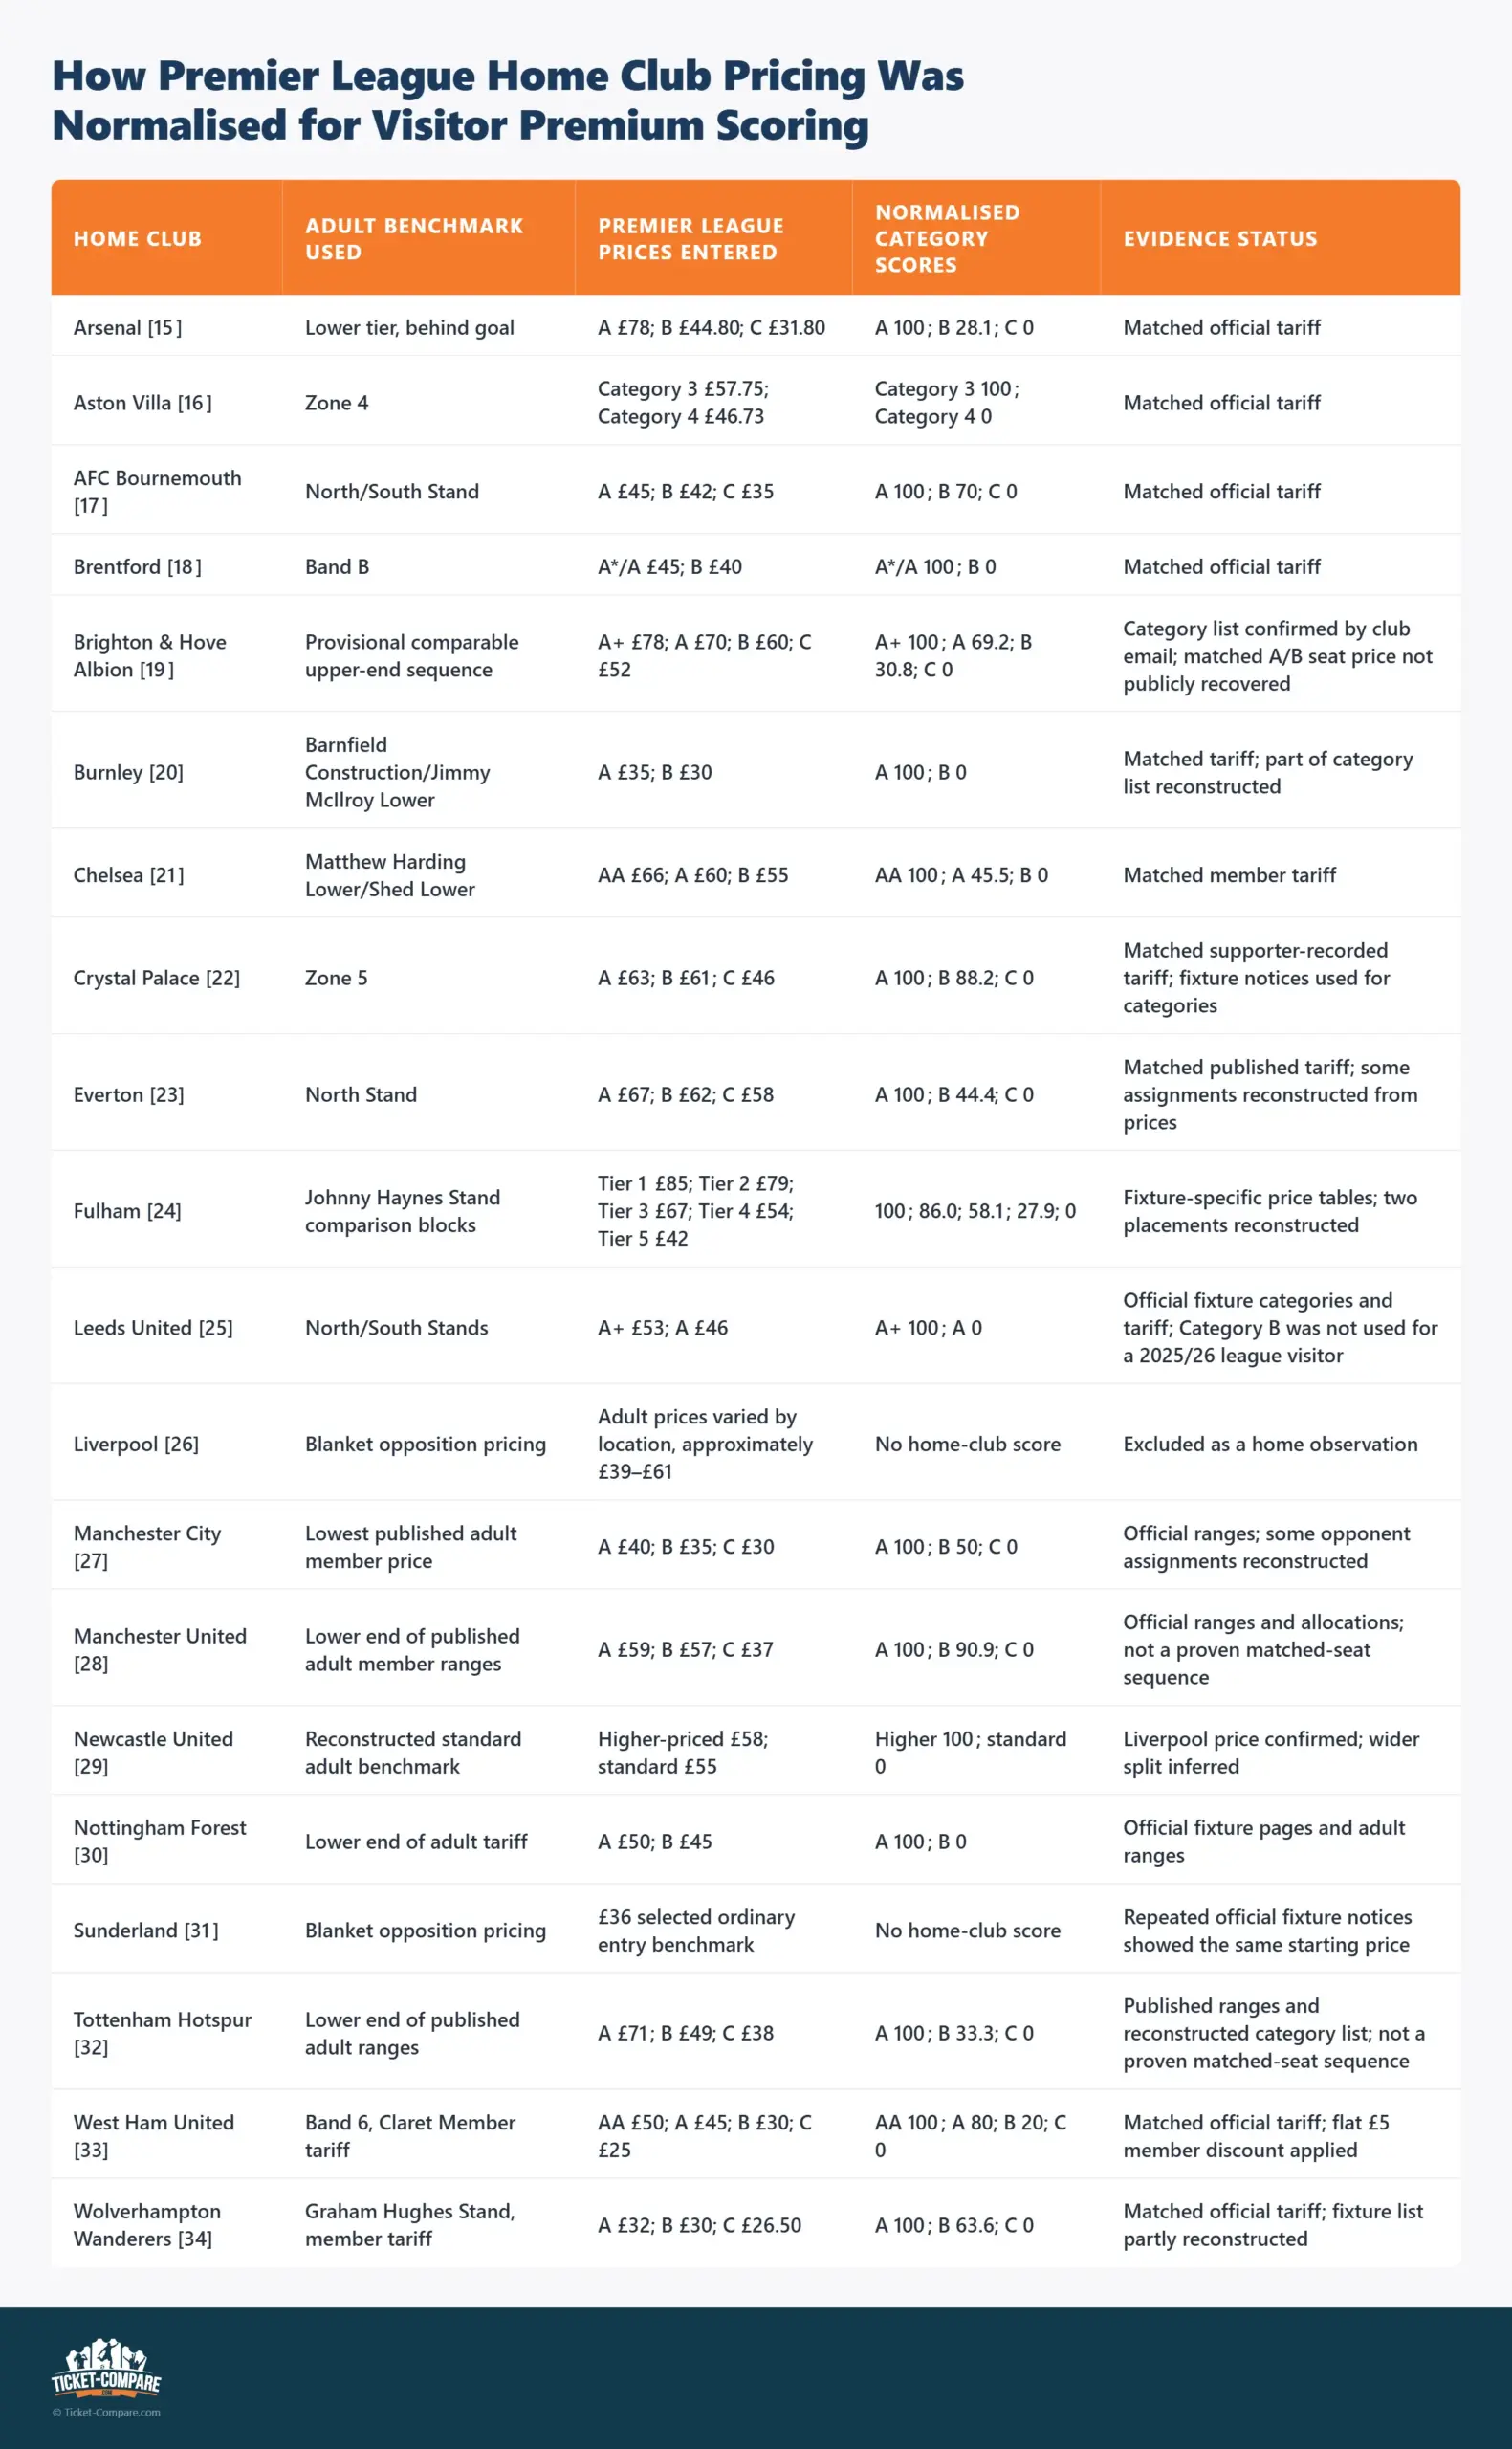
Pricing used:
Special cases
Liverpool and Sunderland
Neither club was entered as a zero-premium home observation. A zero would imply that every visitor had been deliberately placed in a cheapest category. The evidence instead indicated that neither club varied its ordinary home tariff by opposition. Their grounds therefore supplied no information about the relative pricing status of visitors.
Brentford A*
Brentford’s A* fixtures carried tougher Ticket Access Points requirements than ordinary Category A matches, but the adult ticket prices were identical. A* and A therefore received the same pricing score. The access distinction would matter in a category-status study, but not in an index measuring price premiums.
Wolves’ treatment of Arsenal and Aston Villa
Arsenal and Aston Villa had both been Category A fixtures at awkward Wolves in 2024/25 and were initially treated as Category A-level opponents in the 2025/26 pricing structure. Wolves later offered members Category B pricing for both fixtures as part of a reactive effort to stimulate match attendance.
Because the index measures the underlying premium originally attached to each visiting club, this later intervention was treated as a temporary demand-management measure rather than a genuine reassessment of the fixtures’ status. Arsenal and Aston Villa were therefore retained as Category A for the calculation.
West Ham membership discount
West Ham ordinarily offered Claret Members $7 off the published general-sale tariff during the relevant sales window. The same discount was deducted from each category. This changes the pound prices displayed in the main table but not the normalised category scores or the price gaps between categories.
Brighton correspondence
Brighton & Hove Albion’s 2025/26 opponent list was supplied directly by the club’s customer information or supporter services account. The author can provide a screenshot of that email with the research materials and insert its date in source [19].
The public club material corroborates the existence of A+, A, B and C grades, but the exact matched-seat A and B adult prices were not recovered from a permanent public page.
Limitations and confidence
This is a reconstructed league-wide study rather than an official Premier League dataset. The main limitations are:
Brighton’s category list is directly confirmed, but its A and B price inputs remain provisional because a complete matched-seat public tariff was not recovered.
Burnley explicitly published the categories for its first ten home matches; the final nine were reconstructed from later sales information and the two-category structure.
Several Manchester City opponent assignments were inferred from surviving price points and the published A/B/C ranges.
Manchester United and Tottenham use the lower ends of broad adult ranges. Those figures may represent different seat locations rather than one matched seat across all categories.
Newcastle’s $78 higher-price and $74 standard split is the least secure price benchmark in the calculation.
Everton’s category list was reconstructed from fixture-specific prices; Nottingham Forest was the least certain assignment.
Fulham’s Manchester City and Everton placements were reconstructed after the original price tables disappeared.
Wolves’ Fulham classification was the least secure Wolves assignment. Several other Wolves fixtures were recovered from search-indexed copies of dynamic ticket cards.
Club categories can reflect rivalry, policing, fixture timing, opening or final home games and expected demand as well as the visiting club’s general popularity. The index measures the treatment applied, not a pure or universal measure of fanbase size.
The average £ premium is descriptive and should not be used as the principal ranking measure, because a $13 category gap at one stadium is not equivalent to a $13 gap within a very different underlying tariff at another.
The pricing table above makes clear which results rely on complete matched-seat tariffs and which rely on a provisional or reconstructed benchmark.


