
 English

Where Americans Spend the Most on Live Entertainment
Written by Liran Froind | Last updated on October 28, 2025
-Average Concert Grosses 29% More Than a Year Ago
-Top Spending States Span Coasts, While Some Entertainment Hubs Are Thriftier
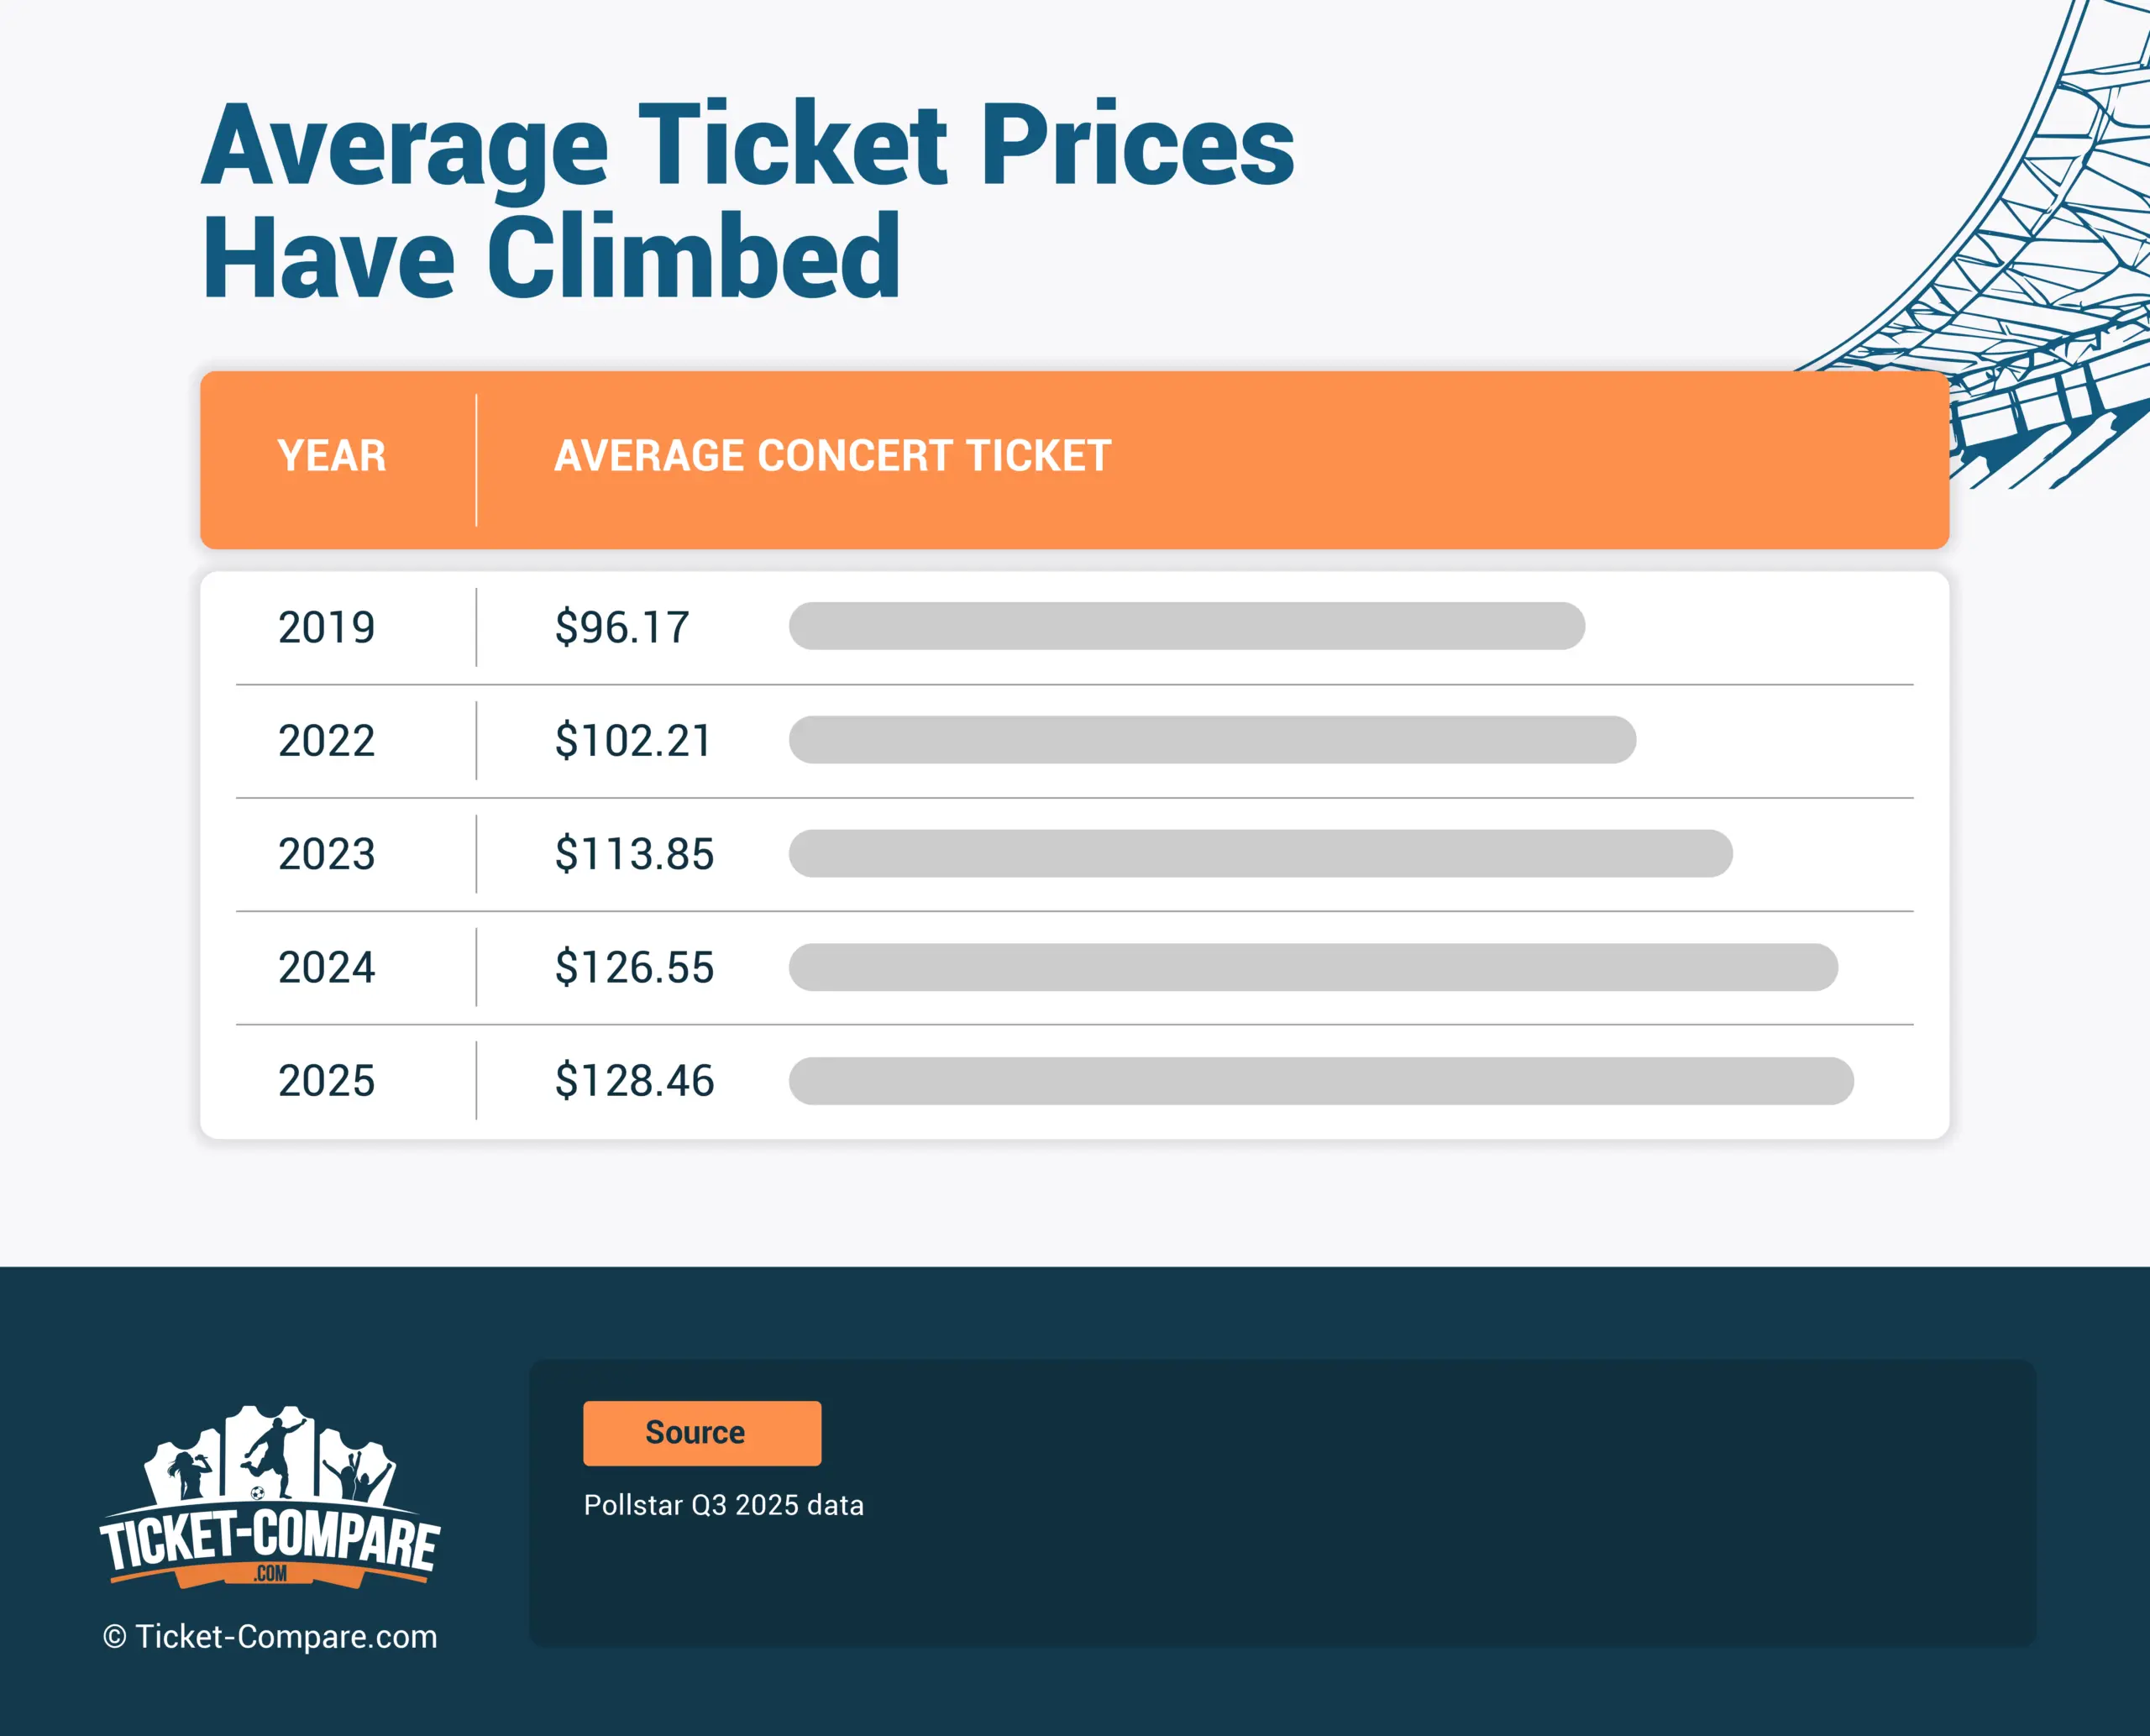
Live entertainment is booming, and so are the prices. In the third quarter of 2025, the average concert ticket cost $128.46, up 34% from the same period just six years earlier, according to the Pollstar music industry data platform.
Musicians are cashing in. Among the top 100 touring artists this year, the average show grossed more than $2.4 million, up a whopping 29% from a year ago, Pollstar said.
Taylor Swift’s record-breaking Eras Tour alone grossed $2 billion in 2023 and 2024, with the average ticket hitting a staggering $1,088, The New York Times reported. With resale platforms like Ticketmaster dominating the ticketing market, high demand and limited supply have turned live shows into luxury experiences for many fans.
Even so, Americans are spending – and showing up – in record numbers. A 2024 Deloitte survey found that 61% of consumers attended at least one live event, whether a concert, comedy show, or theater performance, in the past six months, averaging seven events each.
Younger generations, especially Gen Z and millennials, are leading this cultural revival, treating live experiences as essential rather than occasional splurges.
After years of isolation during the pandemic, audiences are eager to reconnect, and the live experience has become a cultural priority. For many, the emotional payoff of seeing their favorite artists or performers in person outweighs the financial hit.
At the same time, so-called “funflation” has made entertainment costlier across the board. In fact, in 2024 nearly 60% of consumers skipped a live event they wanted to attend because it was too expensive, the Deloitte survey found.
But spending habits vary dramatically across the country. So which states are shelling out the most?
We used federal data to rank where people spend the most and least per year on live entertainment like concerts and theater shows, not including sports, and how those patterns have shifted over the past decade.
The findings reveal how regional preferences, income levels and evolving lifestyles shape where – and how much – Americans are willing to pay for the magic of live entertainment.
![]()
Key Findings:
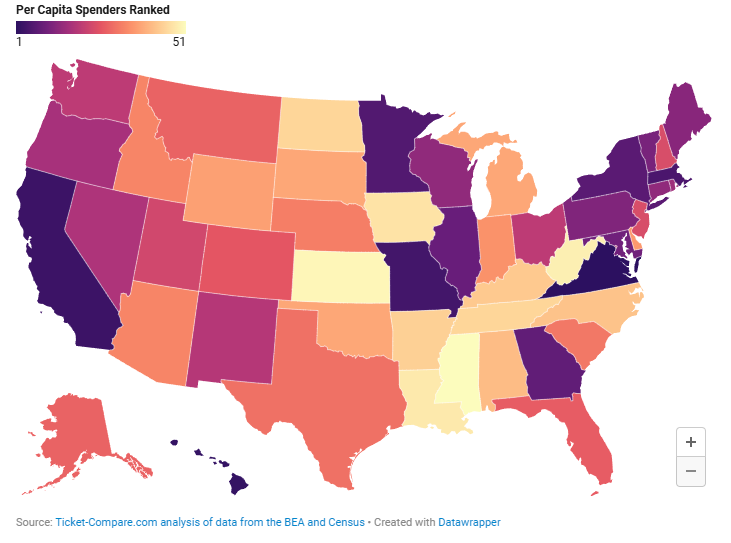
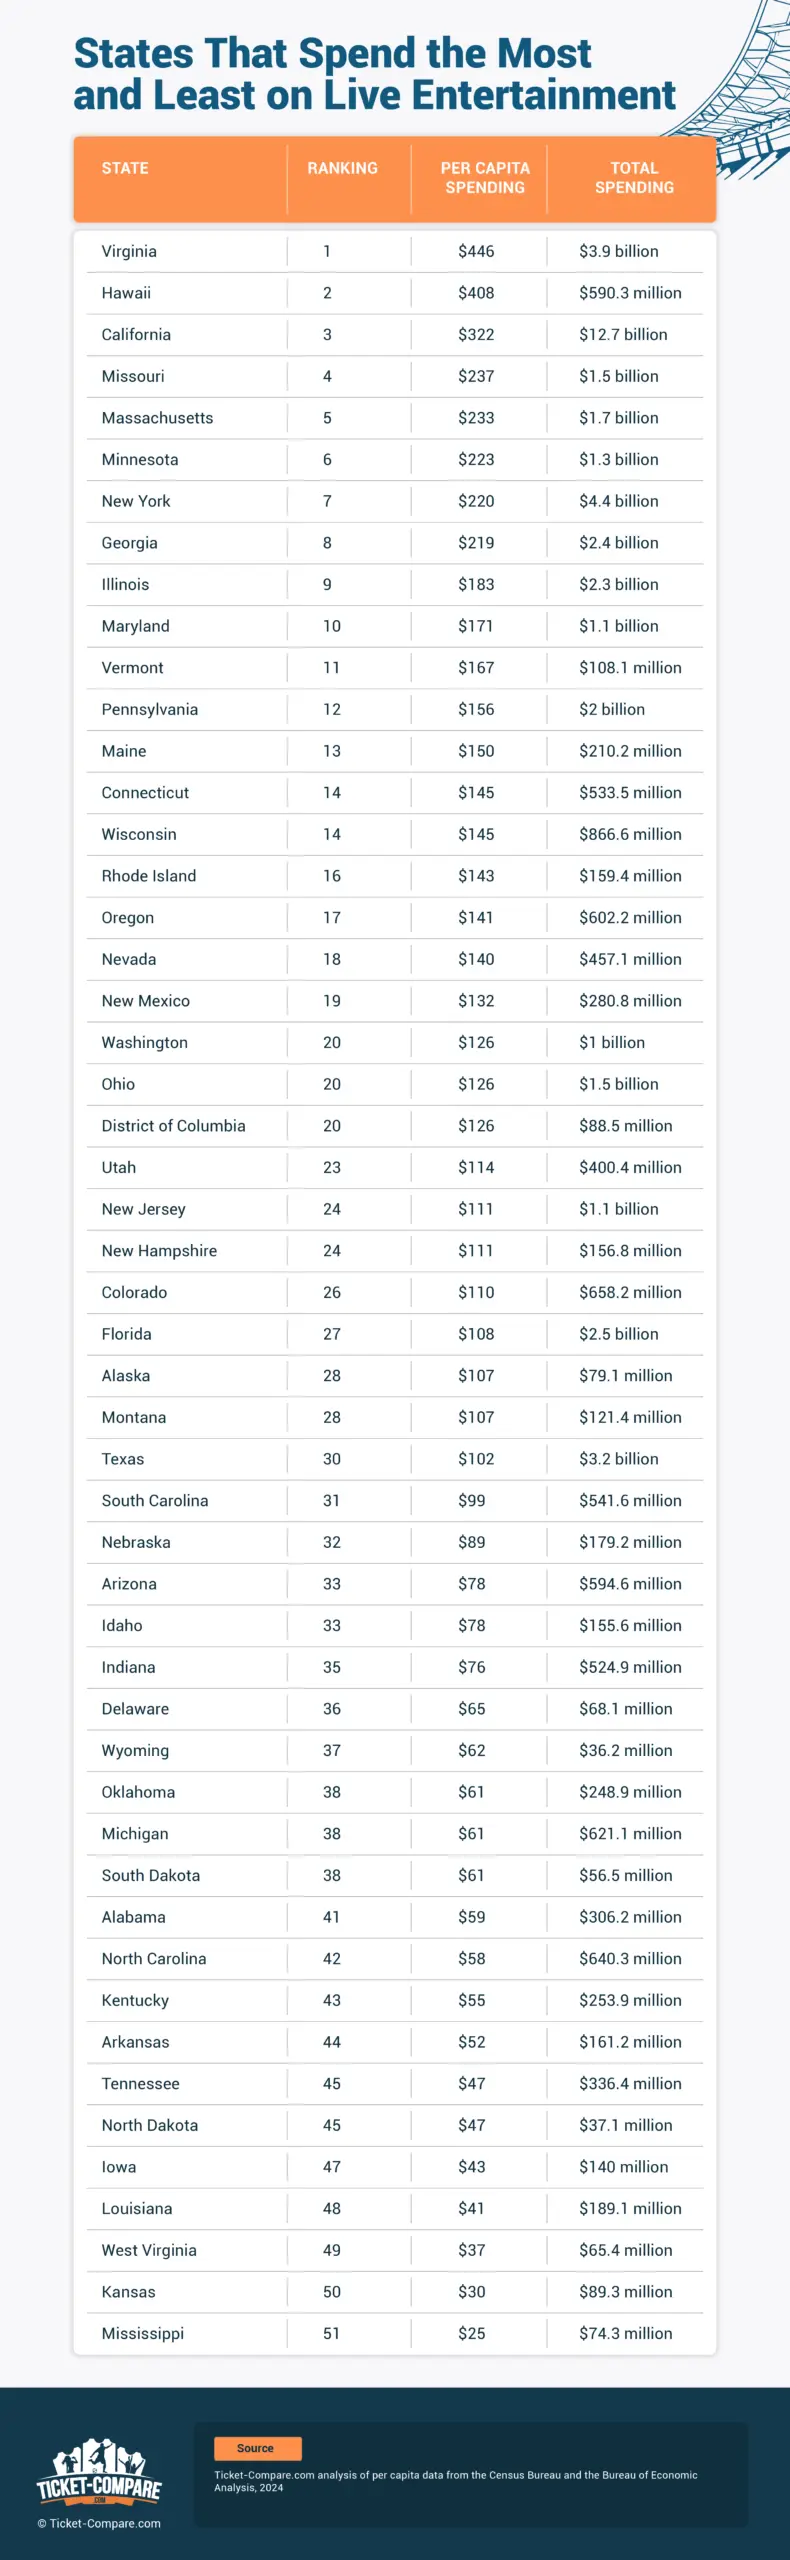
- Spendiest and Most Thrifty States: The average person in Virginia spent $446 on live entertainment in 2024, more than anywhere else. Meanwhile, the average Mississippian spent just $25 – only 6% of Virginia’s level.
- Coastal States Tend to Spend More: In addition to Virginia, the top 10 spenders include Hawaii ($408), California ($322), Massachusetts ($233), New York ($220) and Maryland ($171).
- Some Entertainment Powerhouses Are Among the Most Thrifty States: That may be because states like Louisiana ($41) and Tennessee ($47) offer abundant low-cost or free local entertainment, have lower average incomes, and are hubs of “concert tourism,” drawing visitors from out of state to live events.
- Big Spenders Paid More For Entertainment Over Time: The spendiest states today also tend to be those where spending has risen the most over the past decade. Between 2014 and 2024, average spending rose by over $100 in Virginia ($199), Hawaii ($178), California ($175), Georgia ($132), Missouri ($113) and Minnesota ($106).
Biggest Spenders
Virginia ranked as the nation’s No. 1 state for live entertainment spending, with the average resident spending $446 in 2024. Hawaii followed closely at $408, while California ranked third at $322 per person. Rounding out the top five were Missouri ($237) and Massachusetts ($233).
Notably, California dominated when it came to overall spending, with residents together shelling out nearly $12.68 billion on live entertainment in 2024 – nearly three times as high as the next-ranked state, New York, where people spent $4.37 billion last year. New York ranked No. 7 for per capita spending, at $220.
Overall, these highly ranked states reflect a mix of strong cultural sectors, high demand for live performances, and generally higher spending on recreation overall. Together, they set the benchmark for how much Americans are willing to invest in concerts, theater and other live experiences.
Lowest Spenders
Mississippi ranked as the nation’s most frugal state for live entertainment spending, with residents spending an average of just $25 per person in 2024. Other low-spending states included Kansas ($30), West Virginia ($37), Louisiana ($41), and Iowa ($43).
These states tend to have lower incomes and fewer large-scale entertainment venues, which can limit both access to and spending on major live events. In places like Louisiana, where live music and local performances are often free or low-cost, residents may enjoy abundant entertainment without it showing up in spending data.
Meanwhile, Wyoming came in last when it came to overall spending levels, with residents putting down a combined $36.2 million on live entertainment in 2024. Close behind was North Dakota ($37.1 million), followed by South Dakota ($56.5 million), West Virginia ($65.4 million) and Delaware ($68.1 million). Each of these states also landed toward the bottom on per-capita spending.
Where Spending Has Changed the Most
Not much has changed at the top: Virginia remains the nation’s spendiest state for live entertainment, holding that position in both 2014 and 2024. But the gap has widened. Virginians spent an average of $199 more per person in 2024 than they did a decade earlier – the largest increase of any state.
Close behind were Hawaii (+$178), California (+$175), Georgia (+$132), and Missouri (+$113). These states saw some of the sharpest growth in discretionary spending on concerts, theater, and other live performances, reflecting the overall national trend toward higher participation and ticket costs.
No state saw a decline in live entertainment spending over the past decade. However, growth was minimal in several places. Kansas recorded the smallest increase, rising just $4, from $26 to $30 per person. Modest gains were also observed in Delaware (+$14), Mississippi (+$16), Oklahoma (+$17), and Iowa (+$17). These states consistently ranked near the bottom in 2024 as well, indicating persistently lower spending on live entertainment relative to the rest of the country.
How to Find the Best Deals on Tickets
- Compare prices before you buy. Ticket prices can vary widely between vendors. Before purchasing, visit Ticket-Compare.com to compare prices from multiple verified sellers – you might find the same seat for significantly less.
- Look for off-peak events. In states where live entertainment spending is high, popular shows can sell out fast and cost more. Consider attending midweek or off-season performances, which are often cheaper and easier to find through comparison sites.
- Set up price alerts. Keep track of events you’re interested in and get notified when prices drop so you can grab great deals before they disappear.
- Check for last-minute deals. If you’re flexible with dates or seating, last-minute listings on ticket comparison platforms can offer deep discounts. This works especially well in states with lower overall spending, where events may not sell out quickly.
- Verify seller credibility. Always buy from trusted sources. Ticket-Compare.com only lists verified, reputable sellers, so you can avoid scams and hidden fees while still finding the lowest available prices.
Conclusion
Overall, the data highlights clear regional differences in how much Americans spend on live entertainment, with some states investing heavily in experiences while others take a more budget-conscious approach. These trends reflect varying cultural priorities, access to major venues and economic factors that shape how residents enjoy live events across the country.
Methodology
This ranking measures per-person spending on live entertainment (excluding sports) in each state for 2024. To capture long-term patterns, a secondary ranking examines how this spending has changed over the past decade. To validate the results, a supplementary analysis compared spending levels to state median incomes, confirming that the overall trends in per-capita spending remained consistent even after adjusting for income differences.
Here’s a closer look at the data sources we used:
- Personal consumption expenditures on live entertainment, excluding sports (U.S. Bureau of Economic Analysis, 2014-2024)
- State population (U.S. Census Bureau, 2014-2024)
- Per capita personal income (Federal Reserve Bank of Saint Louis, 2014-2024)


